 5
5peptides
spectra
0.000 | 0.002
0.000 | 0.019
0.049 | 0.089
0.000 | 0.000
0.000 | 0.000
0.000 | 0.012
0.901 | 0.930
0.000 | 0.000
| Plot | Mito | Lyso | Perox | ER | Golgi | PM | Cytosol | Nucleus | |||||
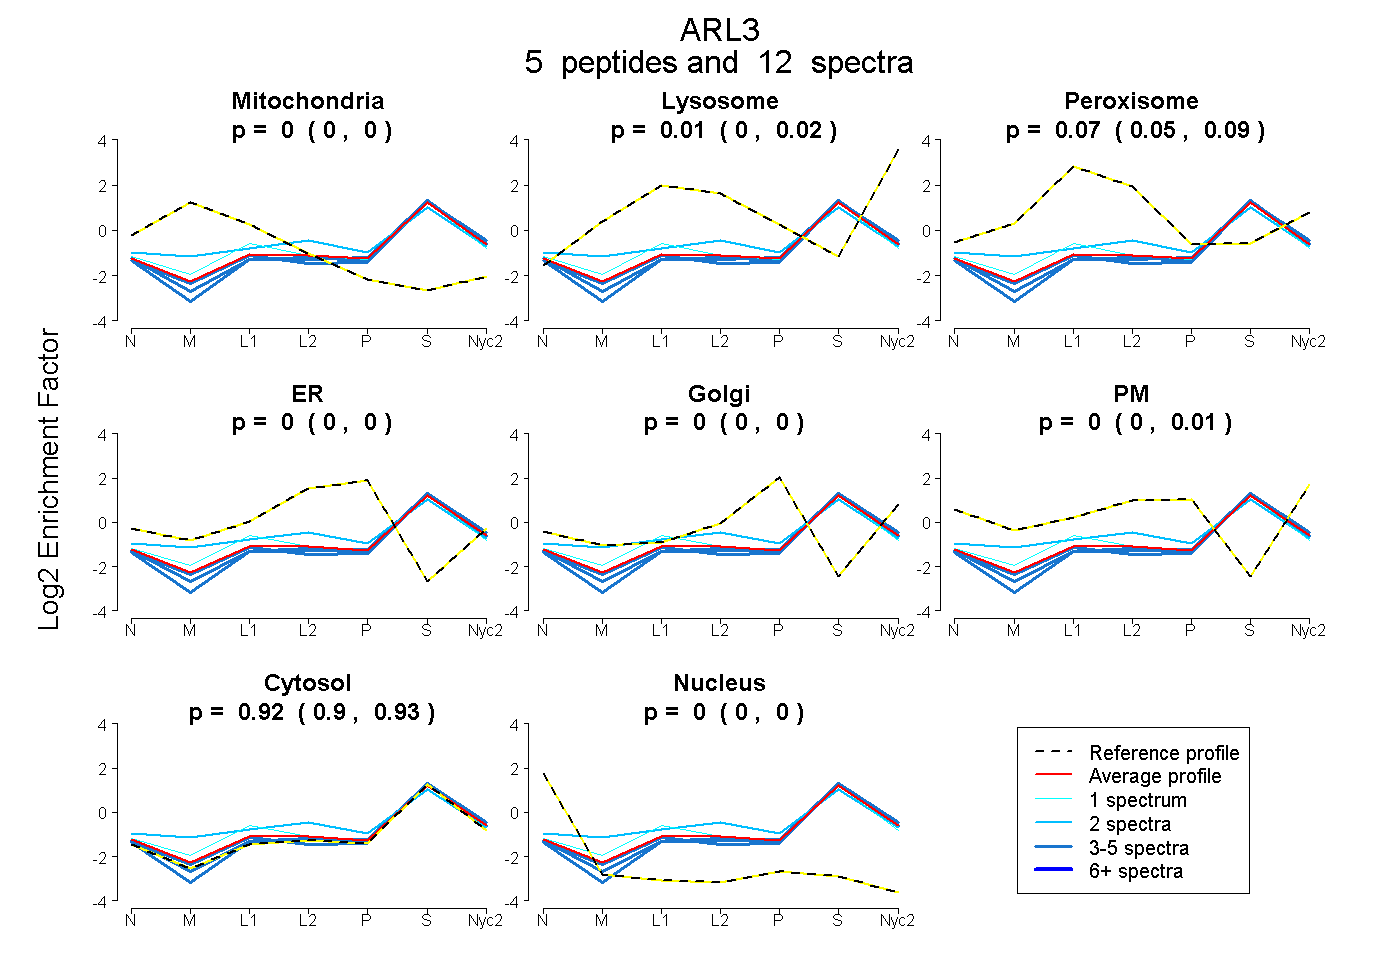
| Expt A |
5 peptides |
12 spectra |
|
0.000 0.000 | 0.002 |
0.009 0.000 | 0.019 |
0.072 0.049 | 0.089 |
0.000 0.000 | 0.000 |
0.000 0.000 | 0.000 |
0.002 0.000 | 0.012 |
0.918 0.901 | 0.930 |
0.000 0.000 | 0.000 |
| 3 spectra, IRPYWR | 0.000 | 0.000 | 0.000 | 0.000 | 0.001 | 0.000 | 0.999 | 0.000 | ||
| 2 spectra, LSCVPVLVFANK | 0.065 | 0.000 | 0.191 | 0.024 | 0.000 | 0.000 | 0.720 | 0.000 | ||
| 3 spectra, ILLLGLDNAGK | 0.000 | 0.034 | 0.000 | 0.000 | 0.000 | 0.000 | 0.966 | 0.000 | ||
| 1 spectrum, SAPDQEVR | 0.025 | 0.000 | 0.129 | 0.000 | 0.000 | 0.000 | 0.846 | 0.000 | ||
| 3 spectra, LNVWDIGGQR | 0.009 | 0.017 | 0.016 | 0.000 | 0.000 | 0.000 | 0.958 | 0.000 |
| Plot | Mito | Lyso or Perox | ER | Golgi | PM | Cytosol | Nucleus | ||||||
| Expt B |
2 peptides |
5 spectra |
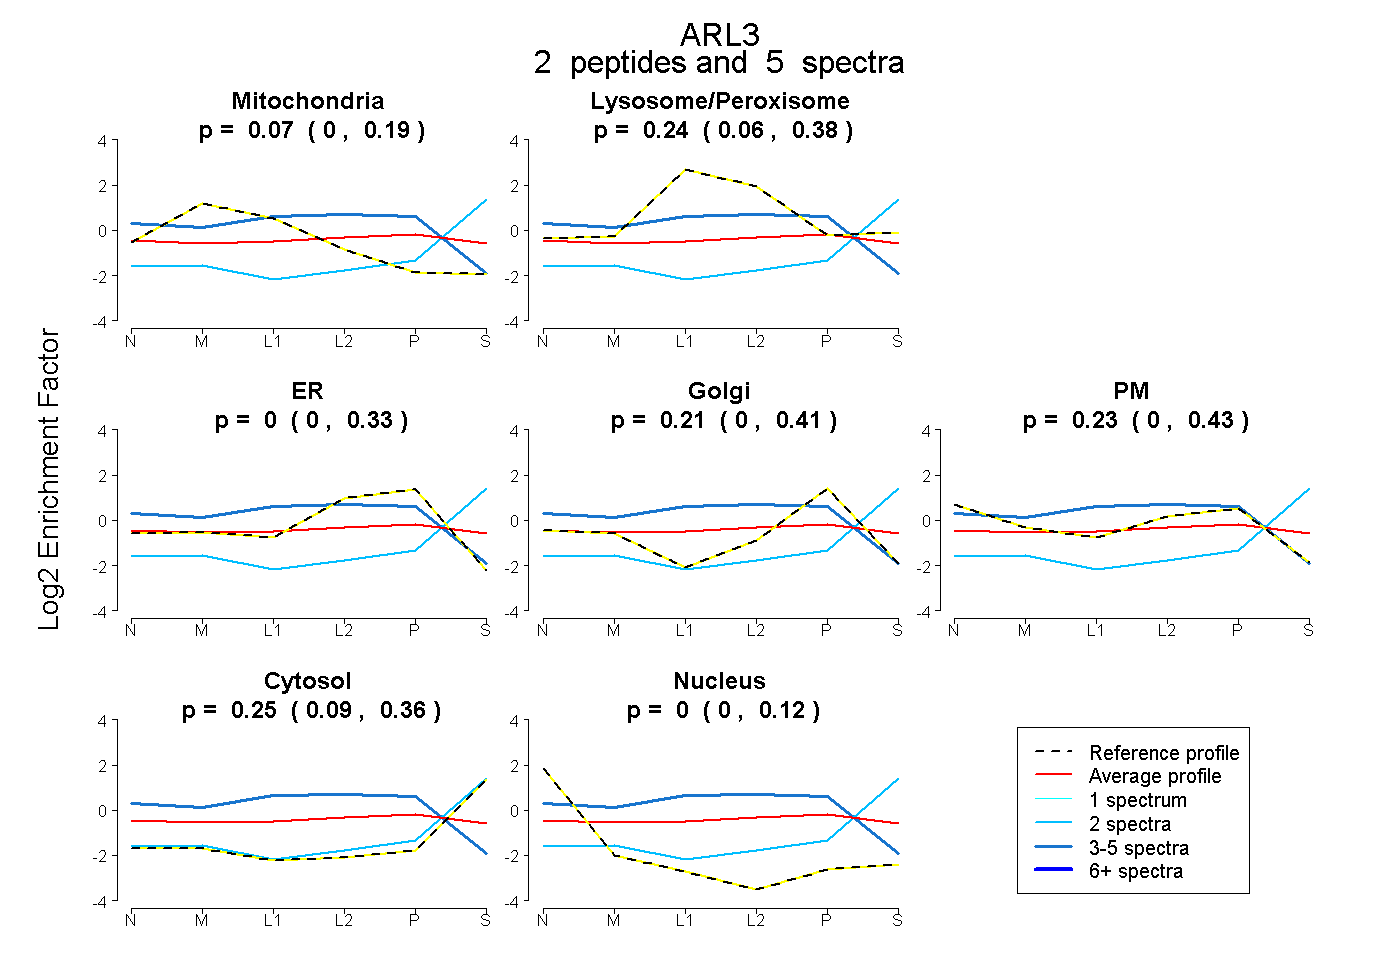 |
0.066 0.000 | 0.186 |
0.240 0.063 | 0.379 |
0.000 0.000 | 0.331 |
0.212 0.000 | 0.415 |
0.228 0.000 | 0.430 |
0.254 0.094 | 0.362 |
0.000 0.000 | 0.116 |
|||
| Plot | Lyso | Other | |||||||||||
| Expt C |
4 peptides |
12 spectra |
 |
0.000 0.000 | 0.000 |
1.000 1.000 | 1.000 |
||||||||
| Plot | Lyso | Other | |||||||||||
| Expt D |
1 peptide |
1 spectrum |
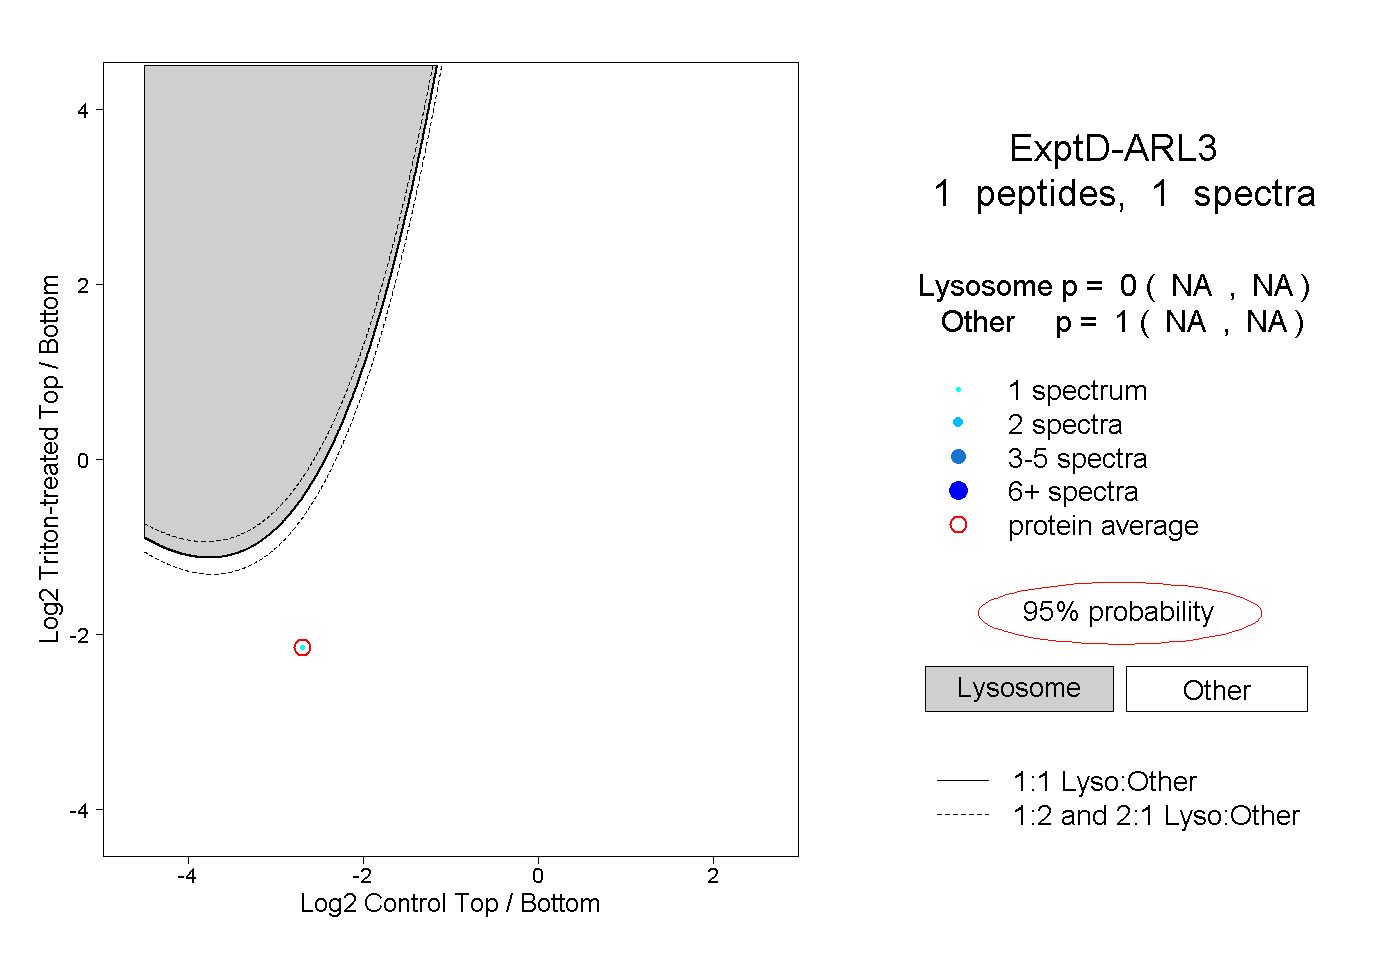 |
0.000 NA | NA |
1.000 NA | NA |