 5
5peptides
spectra
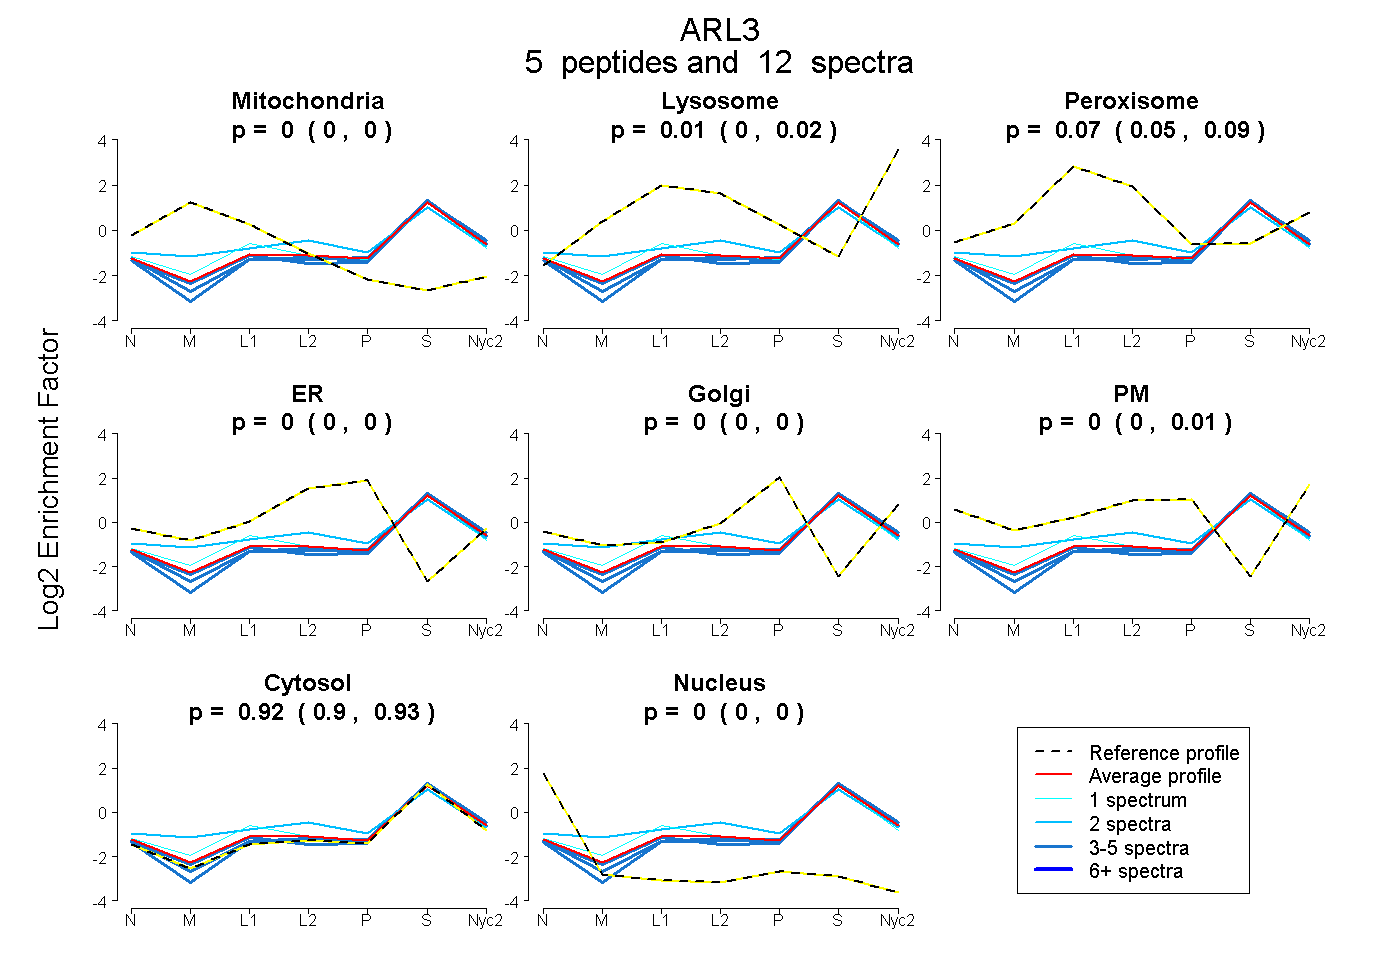
0.000 | 0.002
0.000 | 0.019
0.049 | 0.089
0.000 | 0.000
0.000 | 0.000
0.000 | 0.012
0.901 | 0.930
0.000 | 0.000
2peptides
spectra
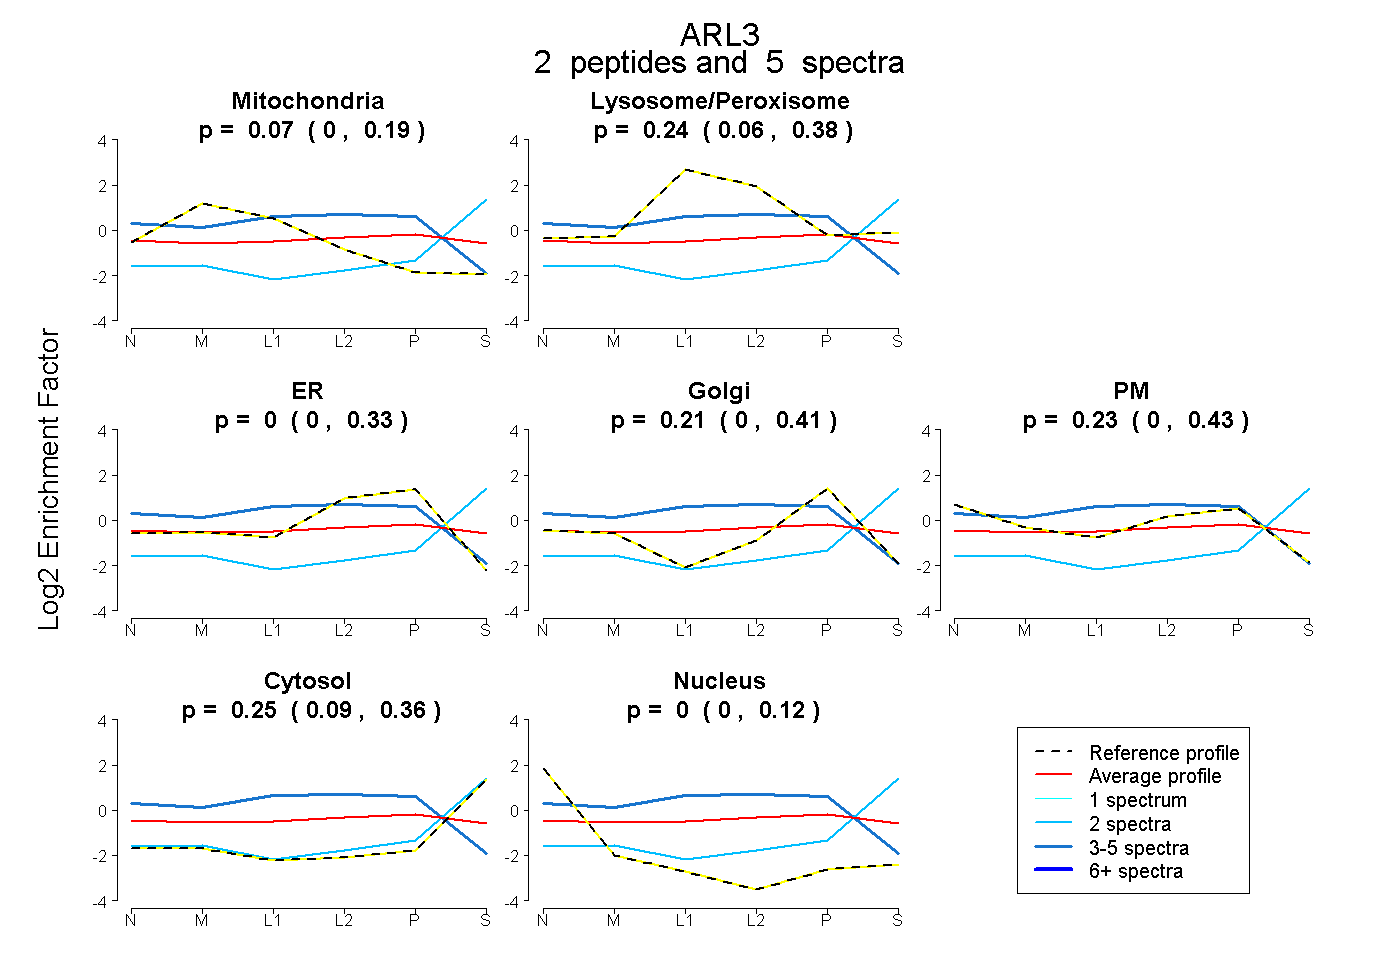
0.000 | 0.186
0.063 | 0.379
0.000 | 0.331
0.000 | 0.415
0.000 | 0.430
0.094 | 0.362
0.000 | 0.116
4peptides
spectra

0.000 | 0.000
1.000 | 1.000
1peptide
spectrum
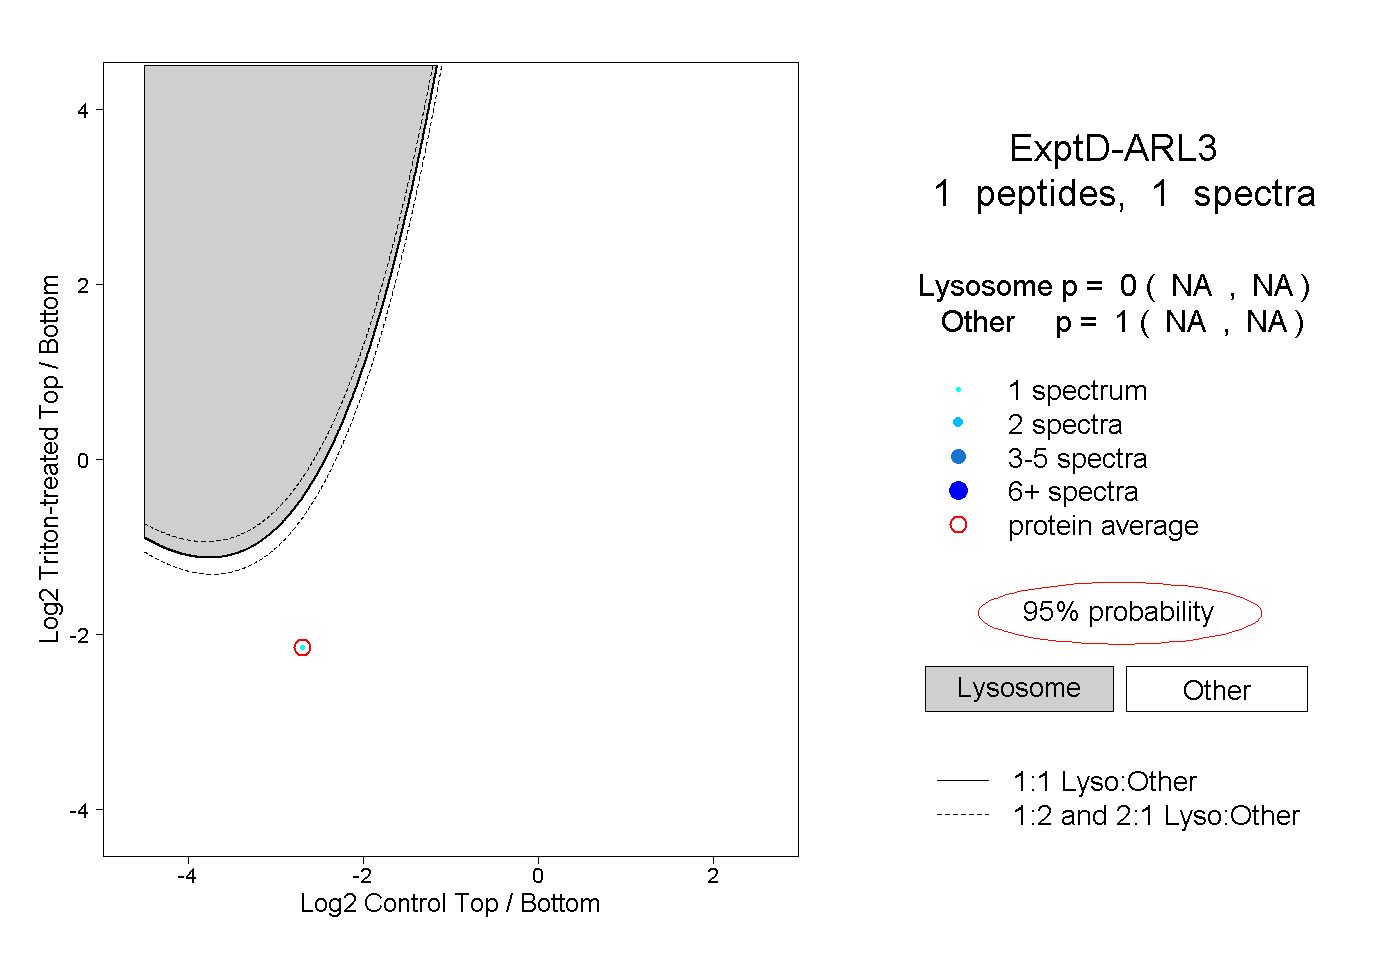
NA | NA
NA | NA