 3
3peptides
spectra
0.116 | 0.264
0.000 | 0.000
0.109 | 0.313
0.000 | 0.293
0.000 | 0.098
0.000 | 0.474
0.098 | 0.227
0.000 | 0.101
3peptides
spectra
0.000 | 0.000
1.000 | 1.000
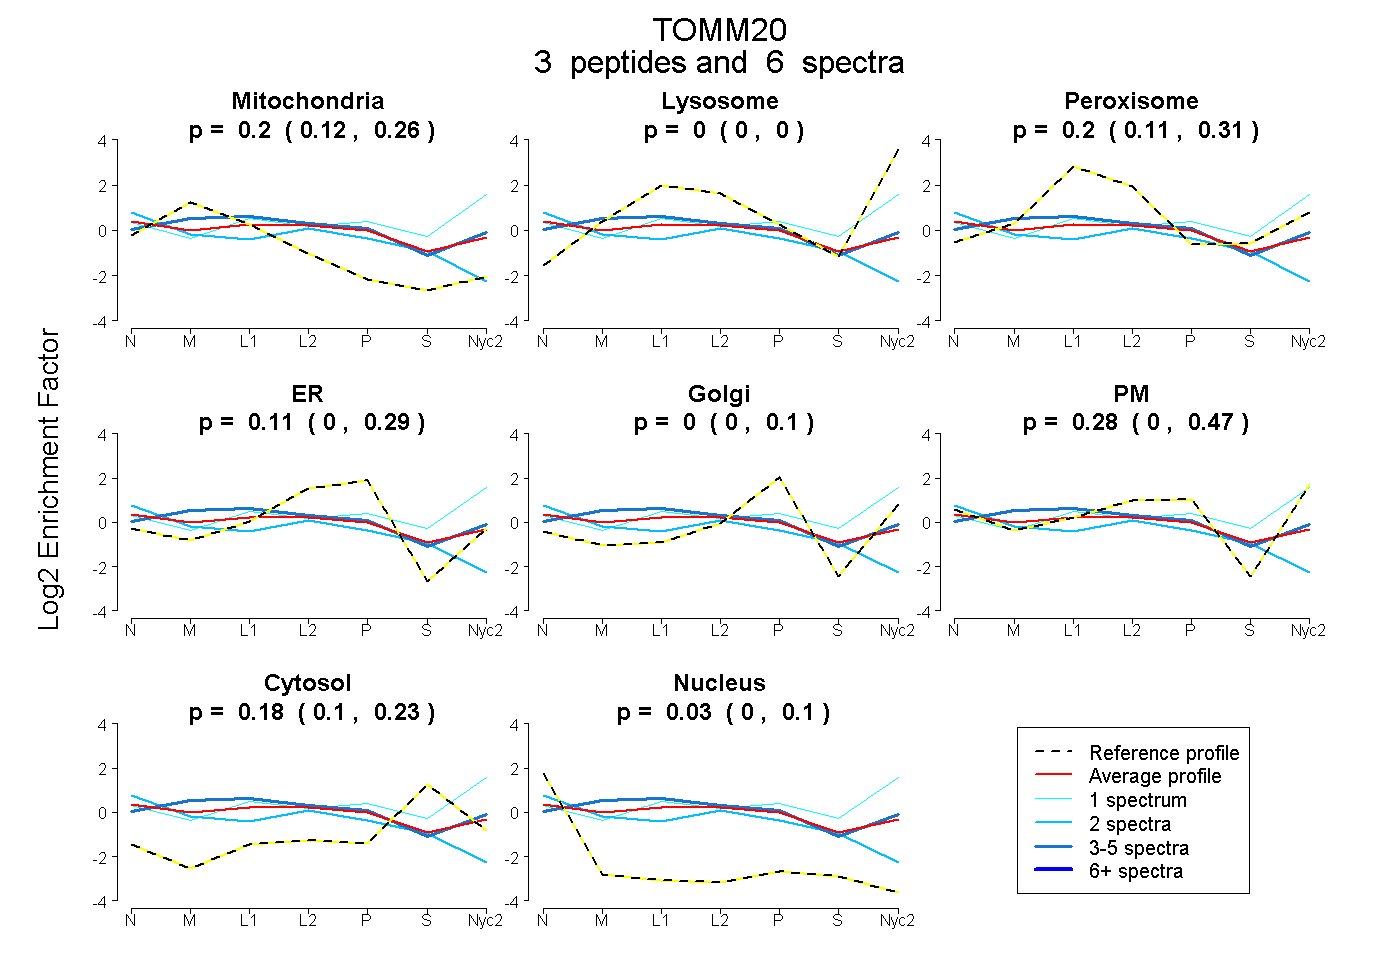
| Plot | Mito | Lyso | Perox | ER | Golgi | PM | Cytosol | Nucleus | |||||
| Expt A |
3 peptides |
6 spectra |
|
0.201 0.116 | 0.264 |
0.000 0.000 | 0.000 |
0.200 0.109 | 0.313 |
0.108 0.000 | 0.293 |
0.000 0.000 | 0.098 |
0.279 0.000 | 0.474 |
0.182 0.098 | 0.227 |
0.030 0.000 | 0.101 |
||
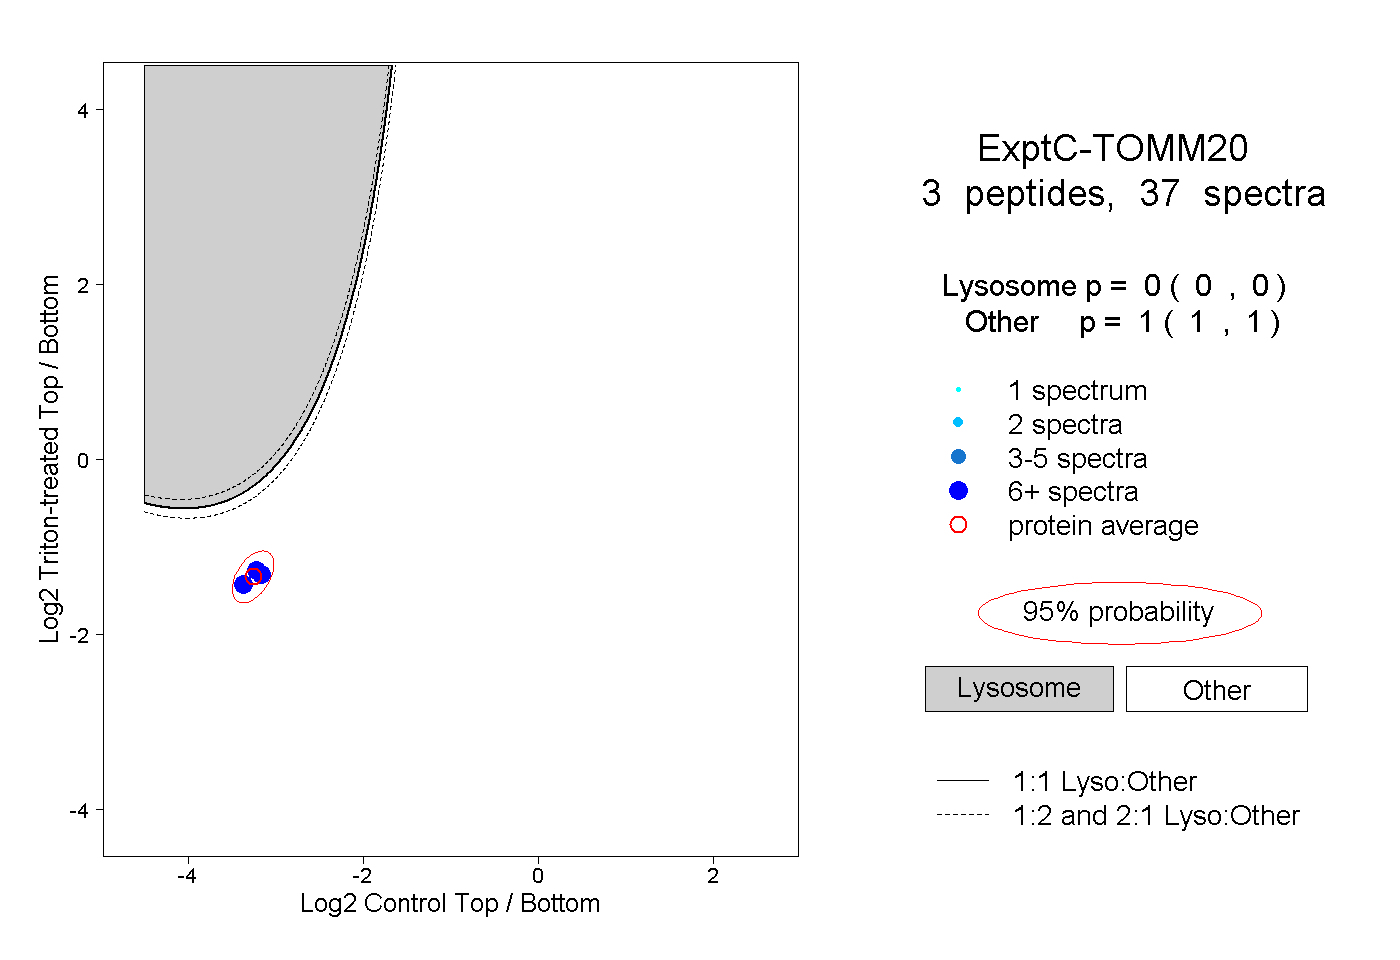
| Plot | Lyso | Other | |||||||||||
| Expt C |
3 peptides |
37 spectra |
|
0.000 0.000 | 0.000 |
1.000 1.000 | 1.000 |
| 12 spectra, DAEAVQK | 0.000 | 1.000 | ||||||||
| 11 spectra, LPTISQR | 0.000 | 1.000 | ||||||||
| 14 spectra, SDPNFK | 0.000 | 1.000 |