 1
1peptide
spectra
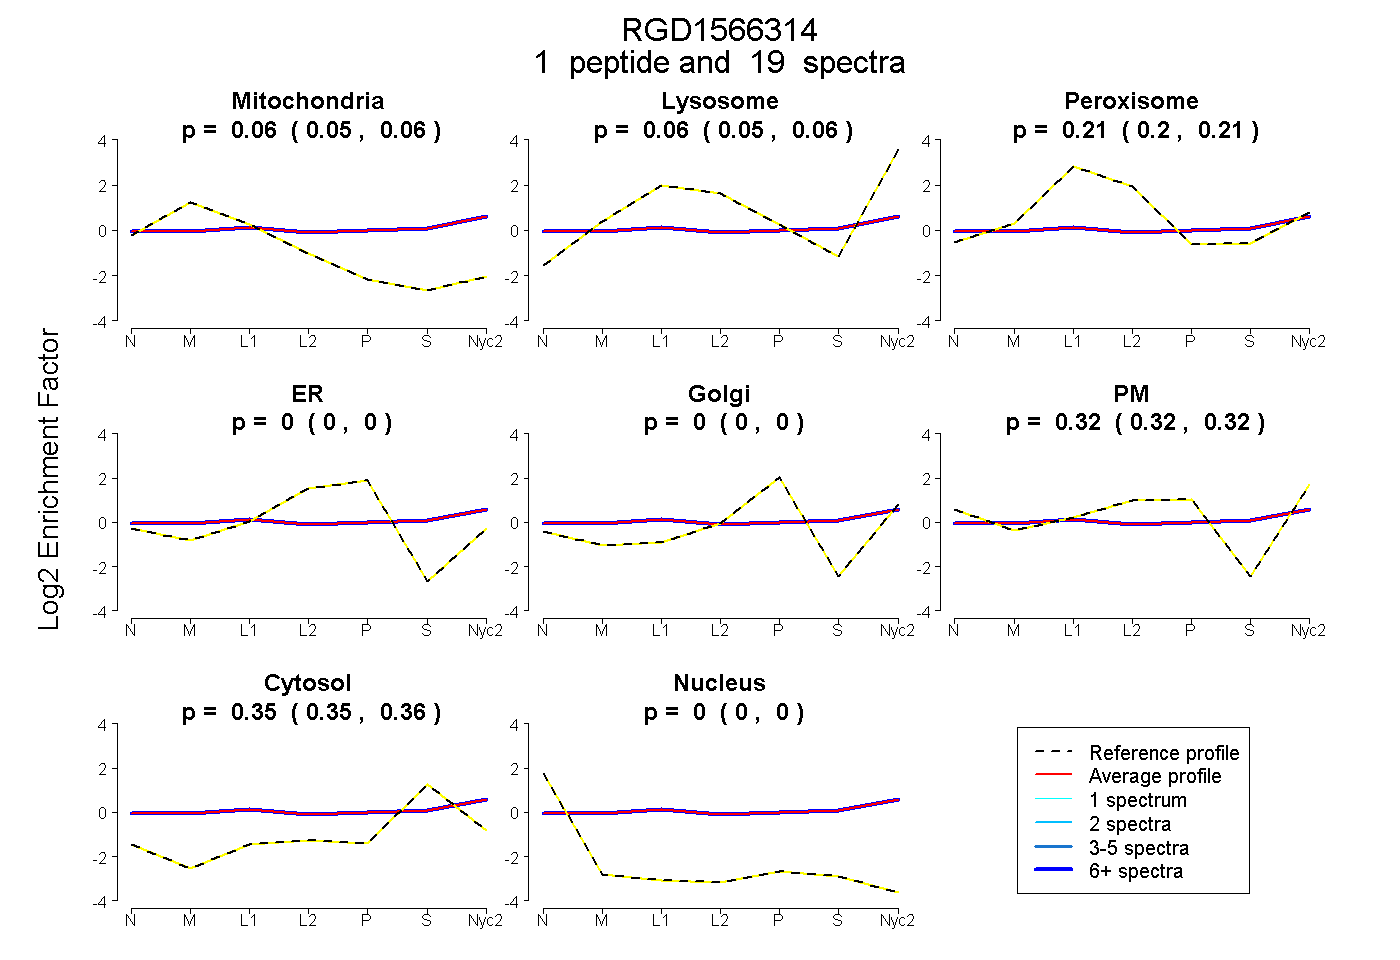
0.055 | 0.060
0.054 | 0.061
0.203 | 0.213
0.000 | 0.000
0.000 | 0.000
0.318 | 0.324
0.352 | 0.356
0.000 | 0.000
1peptide
spectra
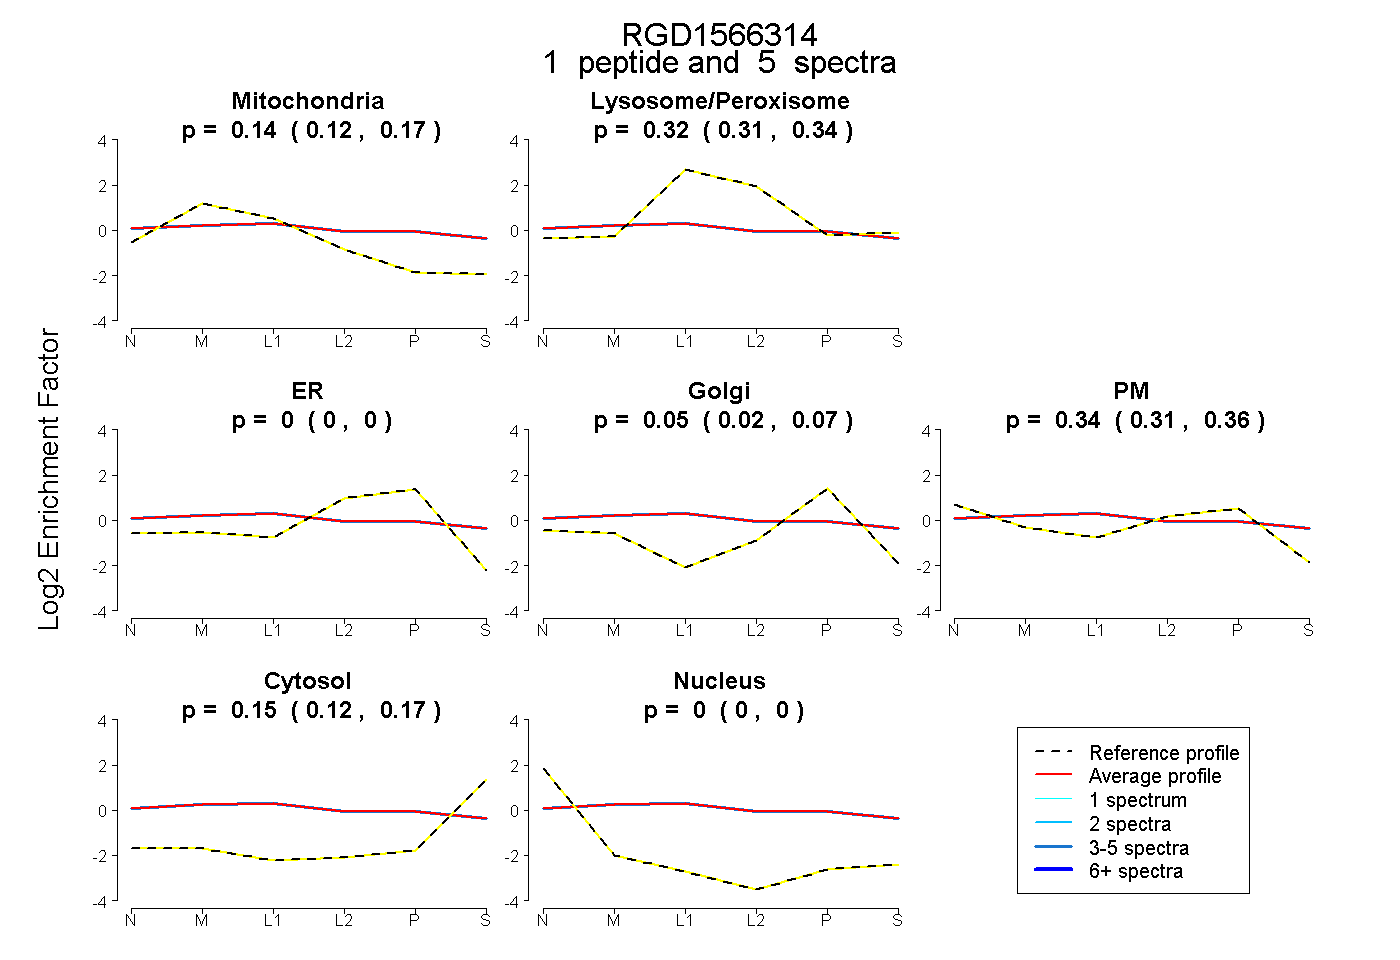
0.116 | 0.168
0.307 | 0.337
0.000 | 0.000
0.016 | 0.072
0.308 | 0.364
0.123 | 0.165
0.000 | 0.000
2peptides
spectra
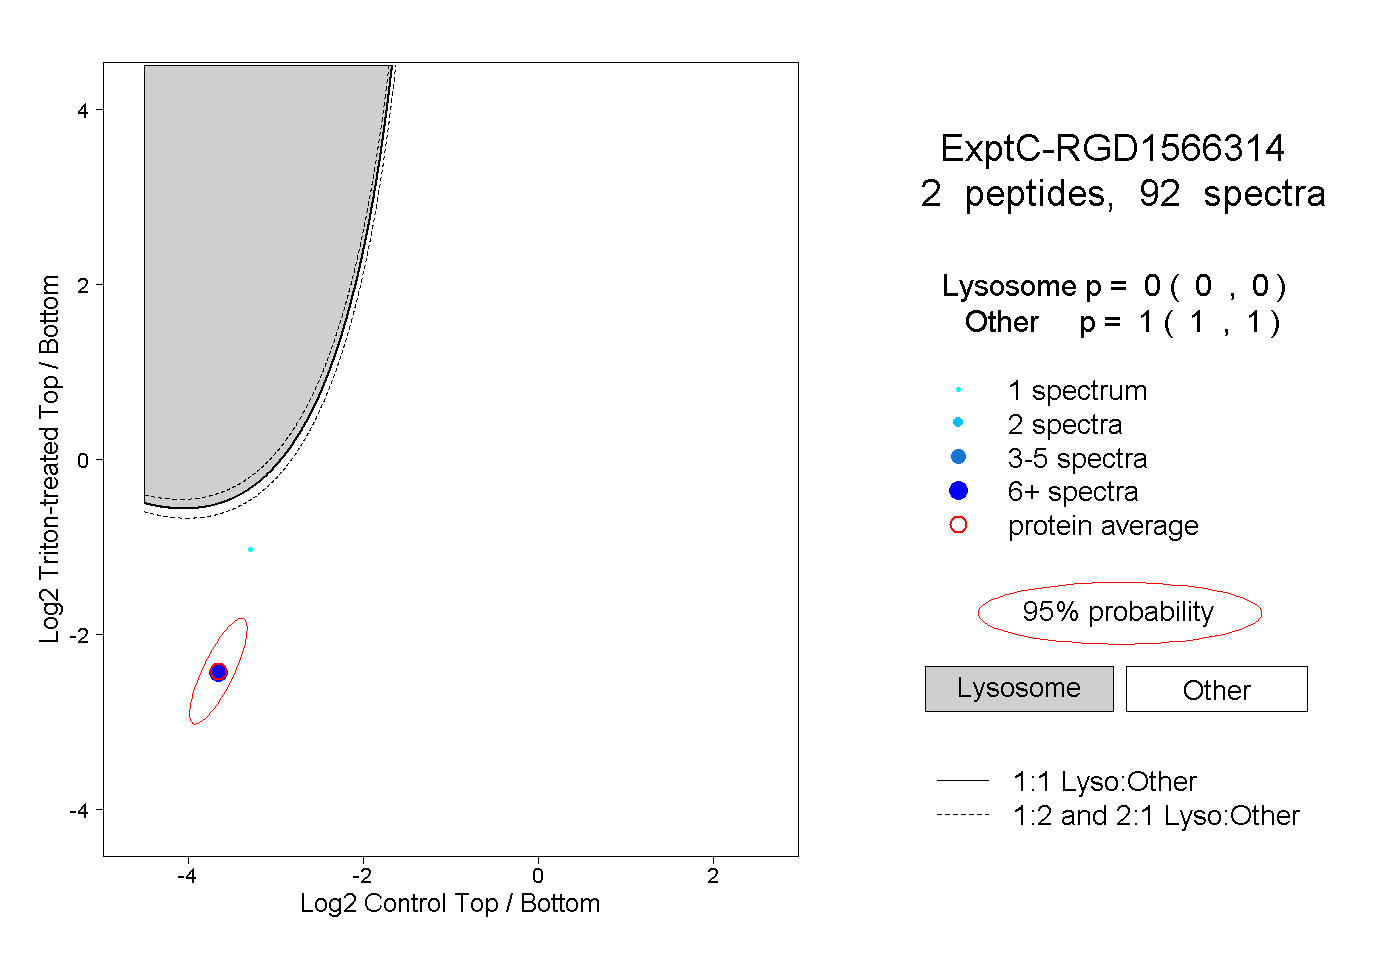
0.000 | 0.000
1.000 | 1.000