 1
1peptide
spectra
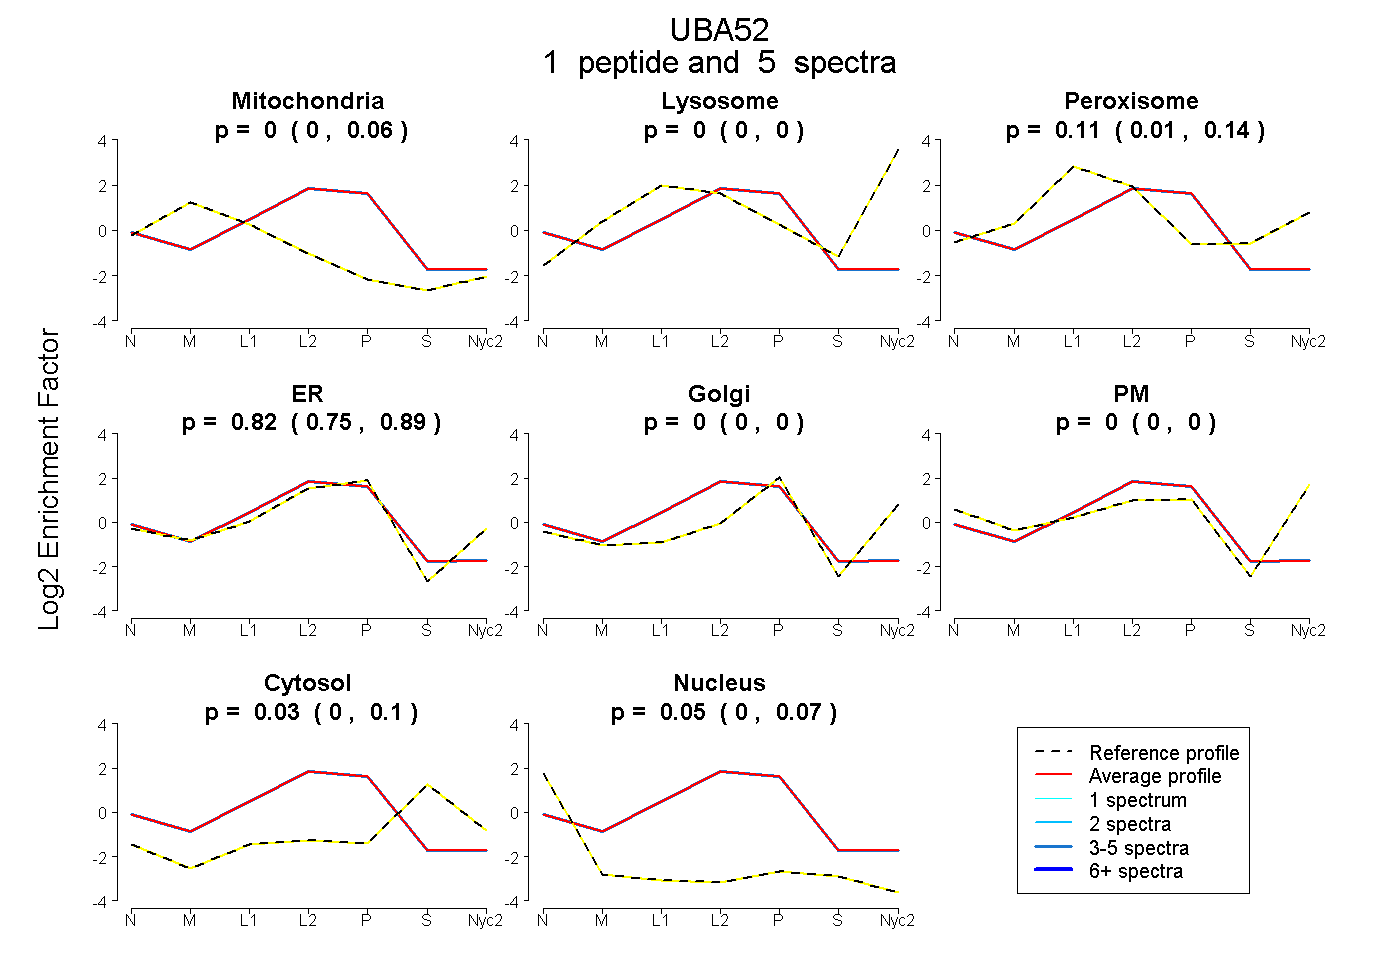
0.000 | 0.055
0.000 | 0.000
0.006 | 0.142
0.745 | 0.888
0.000 | 0.000
0.000 | 0.000
0.000 | 0.101
0.000 | 0.070
1peptide
spectrum
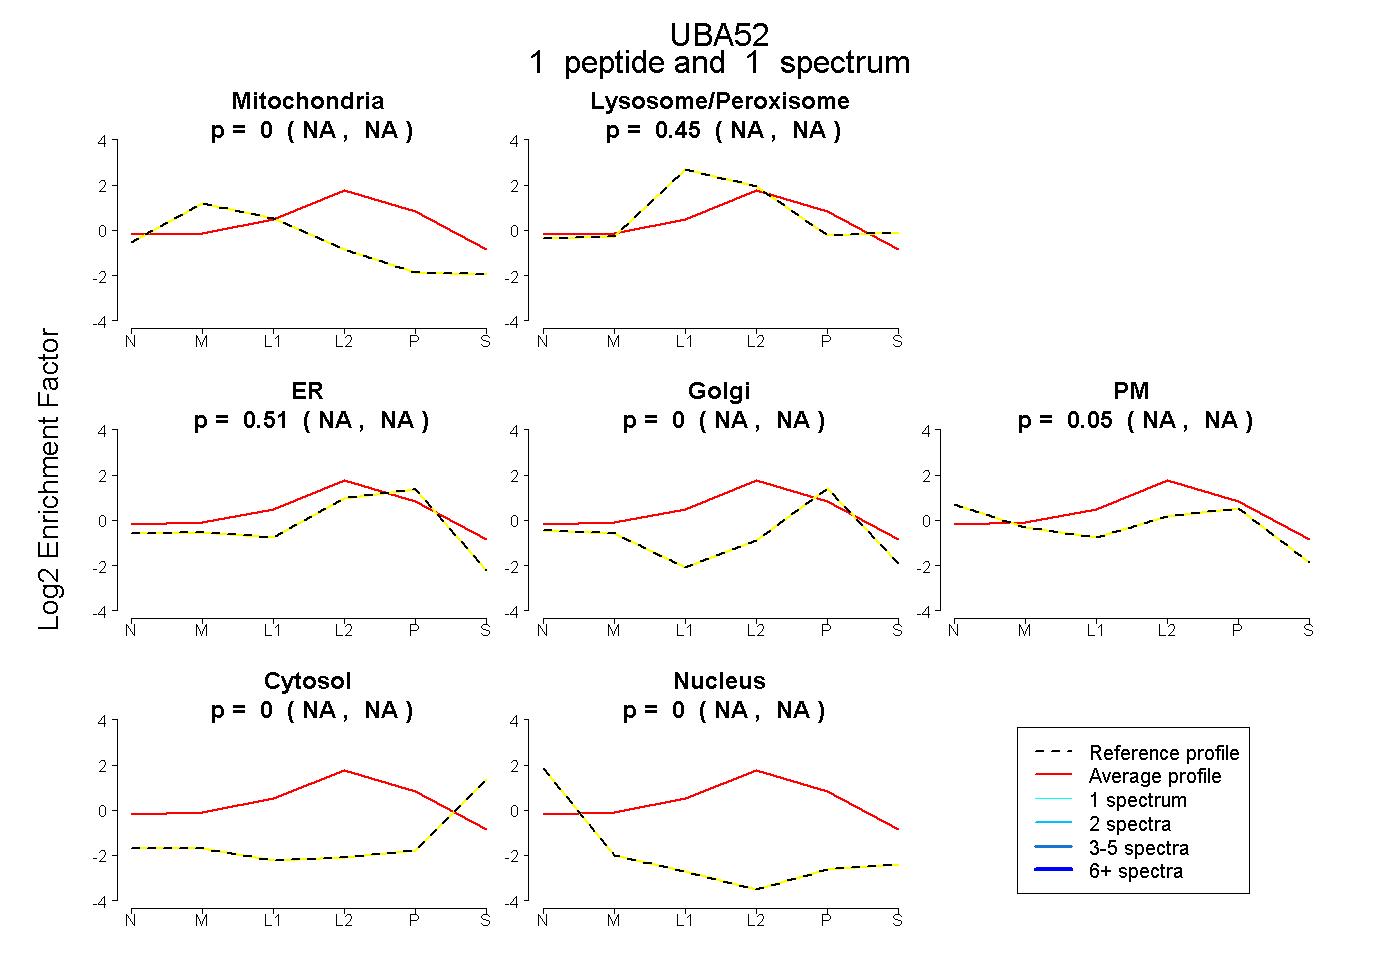
NA | NA
NA | NA
NA | NA
NA | NA
NA | NA
NA | NA
NA | NA
1peptide
spectrum
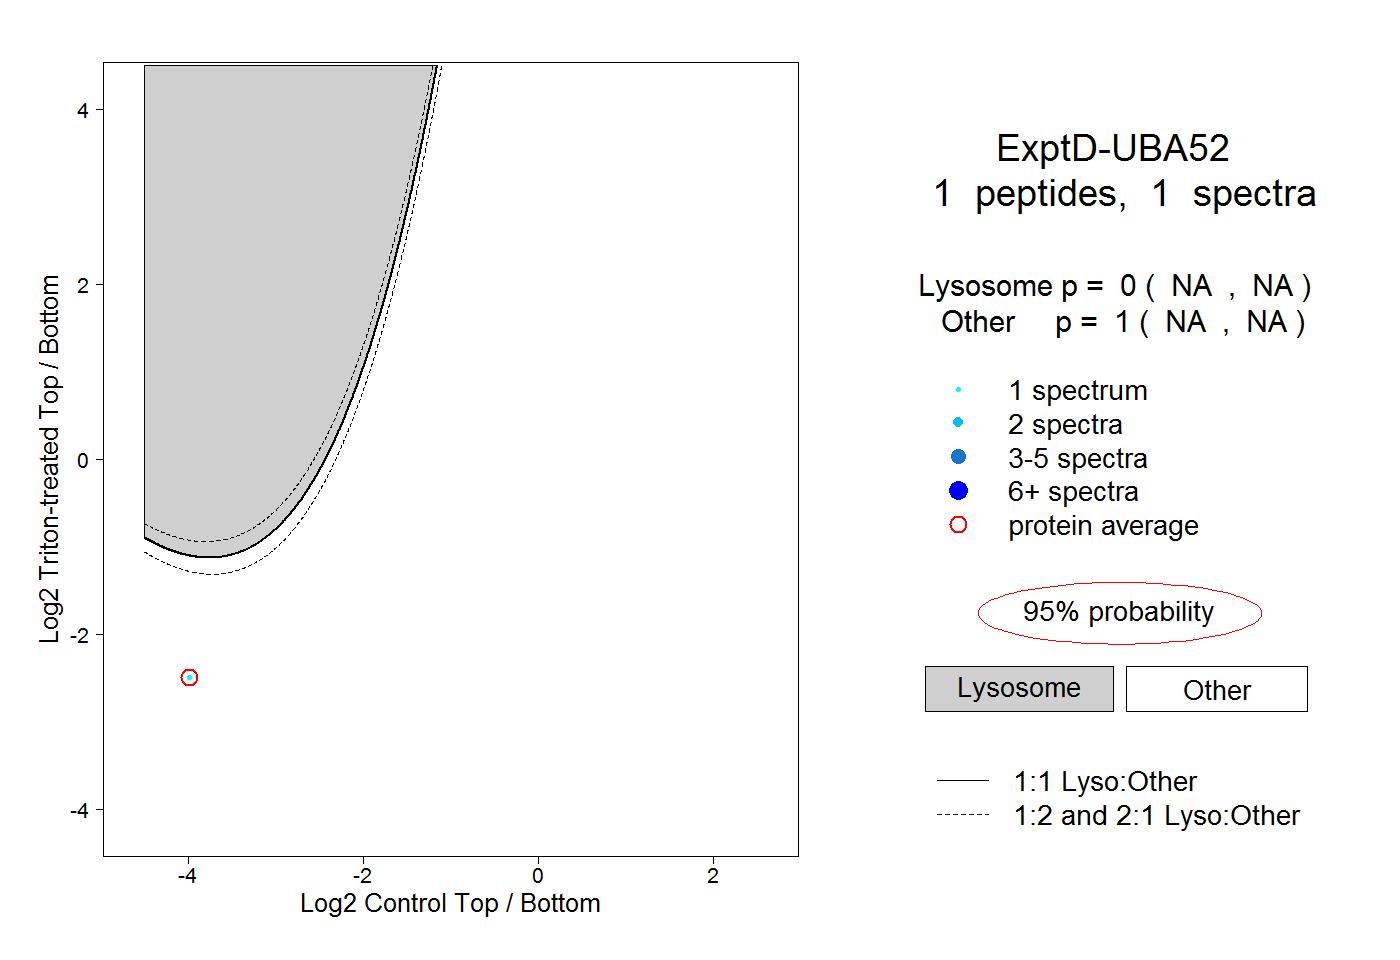
NA | NA
NA | NA