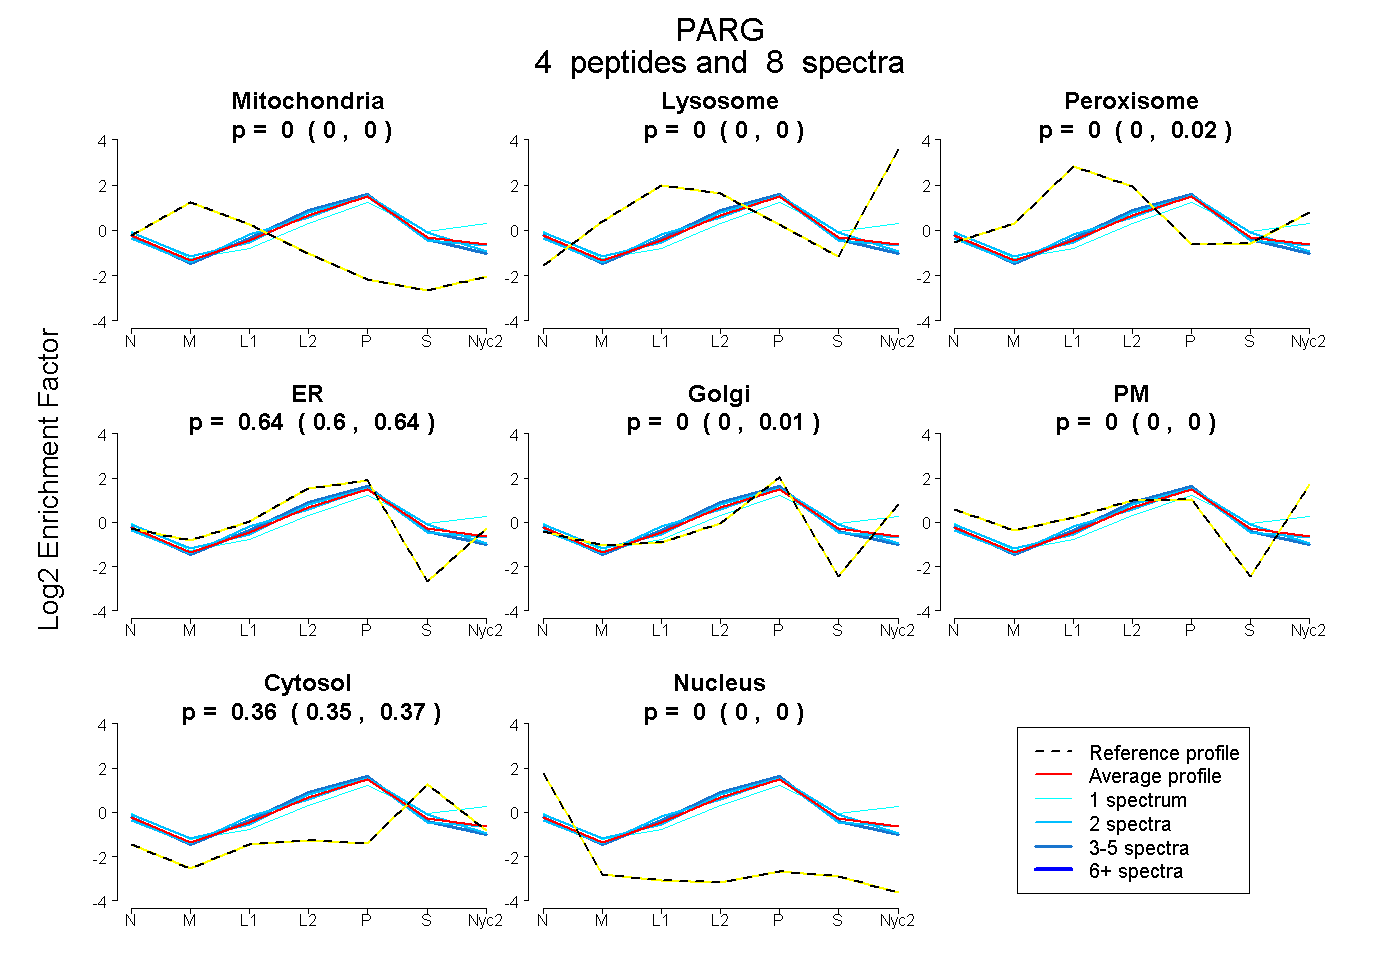
 4
4peptides
spectra
0.000 | 0.000
0.000 | 0.000
0.000 | 0.016
0.602 | 0.643
0.000 | 0.015
0.000 | 0.000
0.349 | 0.372
0.000 | 0.000
| Plot | Mito | Lyso | Perox | ER | Golgi | PM | Cytosol | Nucleus | |||||
| Expt A |
4 peptides |
8 spectra |
|
0.000 0.000 | 0.000 |
0.000 0.000 | 0.000 |
0.000 0.000 | 0.016 |
0.636 0.602 | 0.643 |
0.000 0.000 | 0.015 |
0.000 0.000 | 0.000 |
0.364 0.349 | 0.372 |
0.000 0.000 | 0.000 |
| 2 spectra, KPTGLVTFTR | 0.000 | 0.000 | 0.000 | 0.669 | 0.000 | 0.000 | 0.331 | 0.000 | ||
| 3 spectra, FLINPELIVSR | 0.000 | 0.000 | 0.000 | 0.665 | 0.000 | 0.000 | 0.335 | 0.000 | ||
| 2 spectra, GMLQVDFANR | 0.000 | 0.000 | 0.019 | 0.597 | 0.000 | 0.000 | 0.383 | 0.000 | ||
| 1 spectrum, AGEVPKPFPTHYK | 0.000 | 0.000 | 0.005 | 0.178 | 0.188 | 0.250 | 0.379 | 0.000 |
| Plot | Lyso | Other | |||||||||||
| Expt C |
3 peptides |
5 spectra |
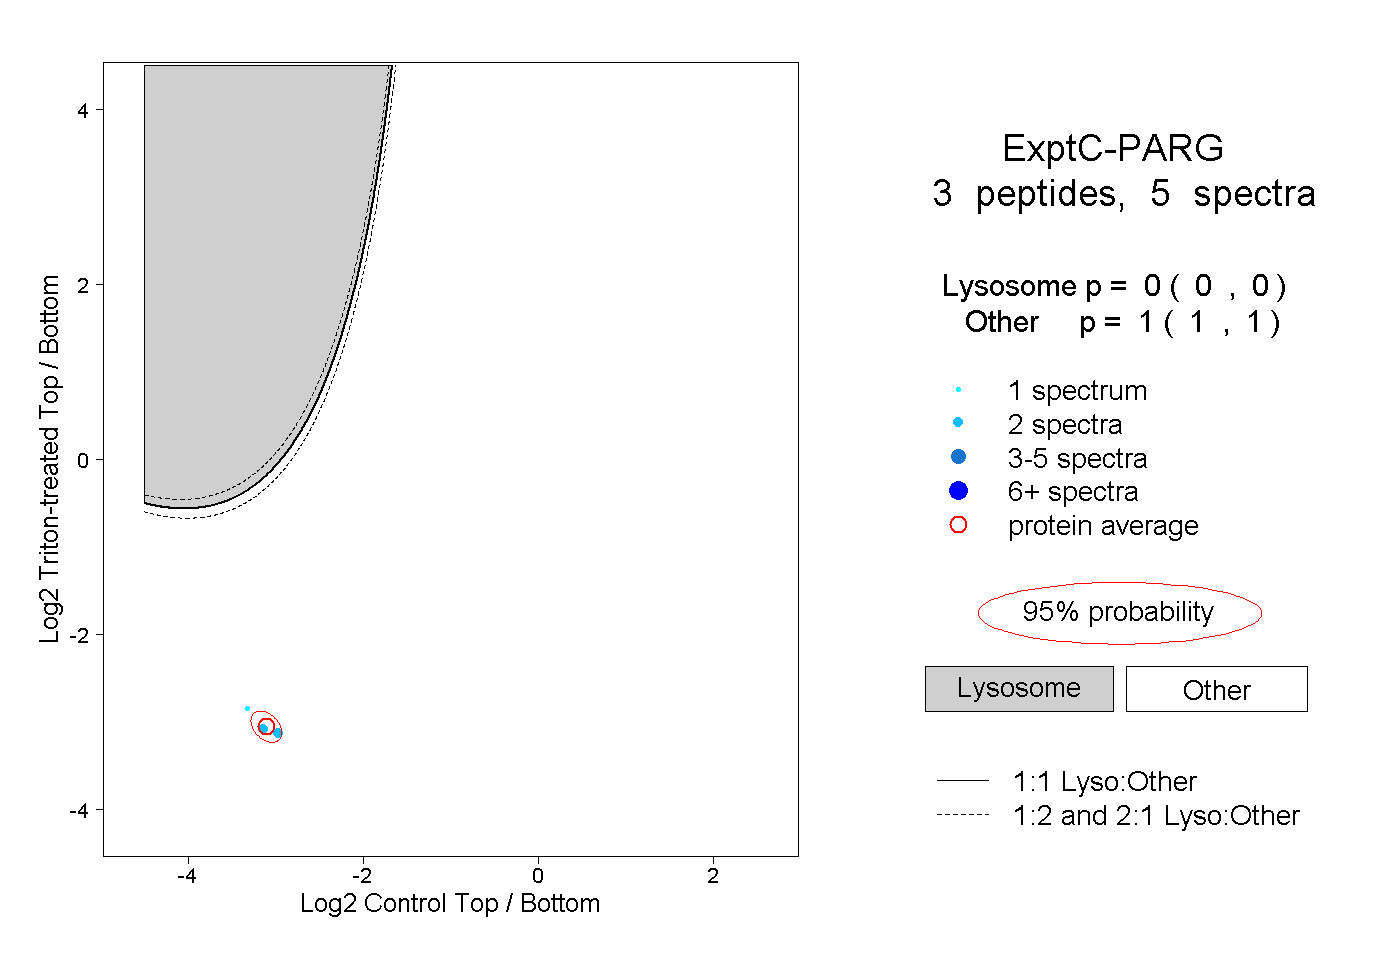 |
0.000 0.000 | 0.000 |
1.000 1.000 | 1.000 |