 2
2peptides
spectra
0.000 | 0.000
0.845 | 0.968
0.000 | 0.111
0.000 | 0.004
0.000 | 0.000
0.000 | 0.000
0.000 | 0.078
0.000 | 0.000
3peptides
spectra
0.915 | 1.000
0.000 | 0.083
| Plot | Mito | Lyso | Perox | ER | Golgi | PM | Cytosol | Nucleus | |||||
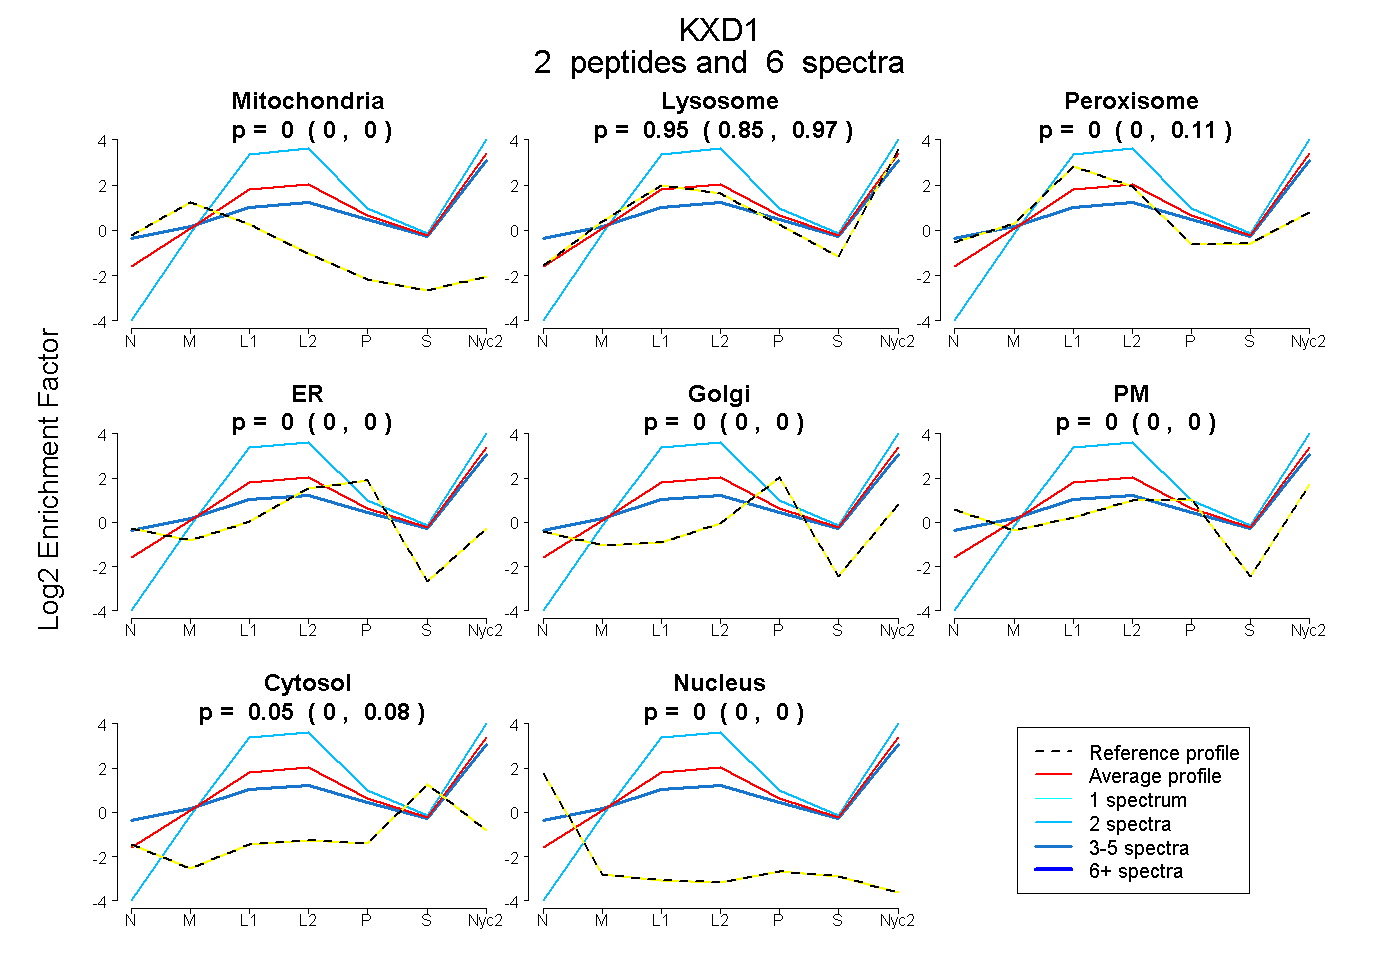
| Expt A |
2 peptides |
6 spectra |
|
0.000 0.000 | 0.000 |
0.946 0.845 | 0.968 |
0.005 0.000 | 0.111 |
0.000 0.000 | 0.004 |
0.000 0.000 | 0.000 |
0.000 0.000 | 0.000 |
0.049 0.000 | 0.078 |
0.000 0.000 | 0.000 |
||
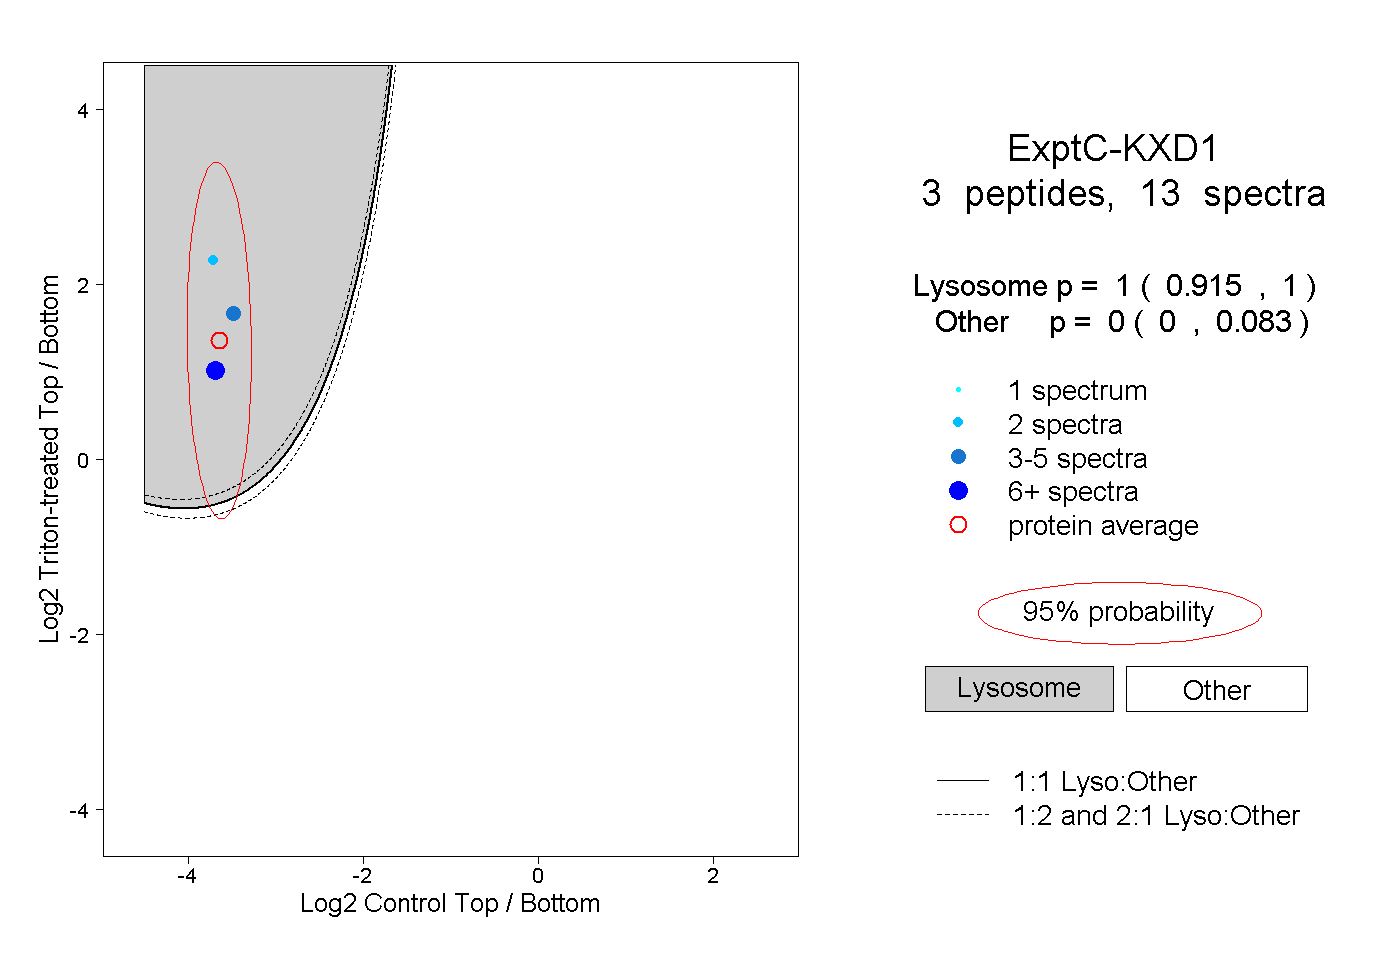
| Plot | Lyso | Other | |||||||||||
| Expt C |
3 peptides |
13 spectra |
|
1.000 0.915 | 1.000 |
0.000 0.000 | 0.083 |