 1
1peptide
spectra
0.000 | 0.084
0.000 | 0.000
0.599 | 0.720
0.000 | 0.114
0.000 | 0.091
0.000 | 0.065
0.149 | 0.222
0.000 | 0.028
1peptide
spectra
NA | NA
NA | NA
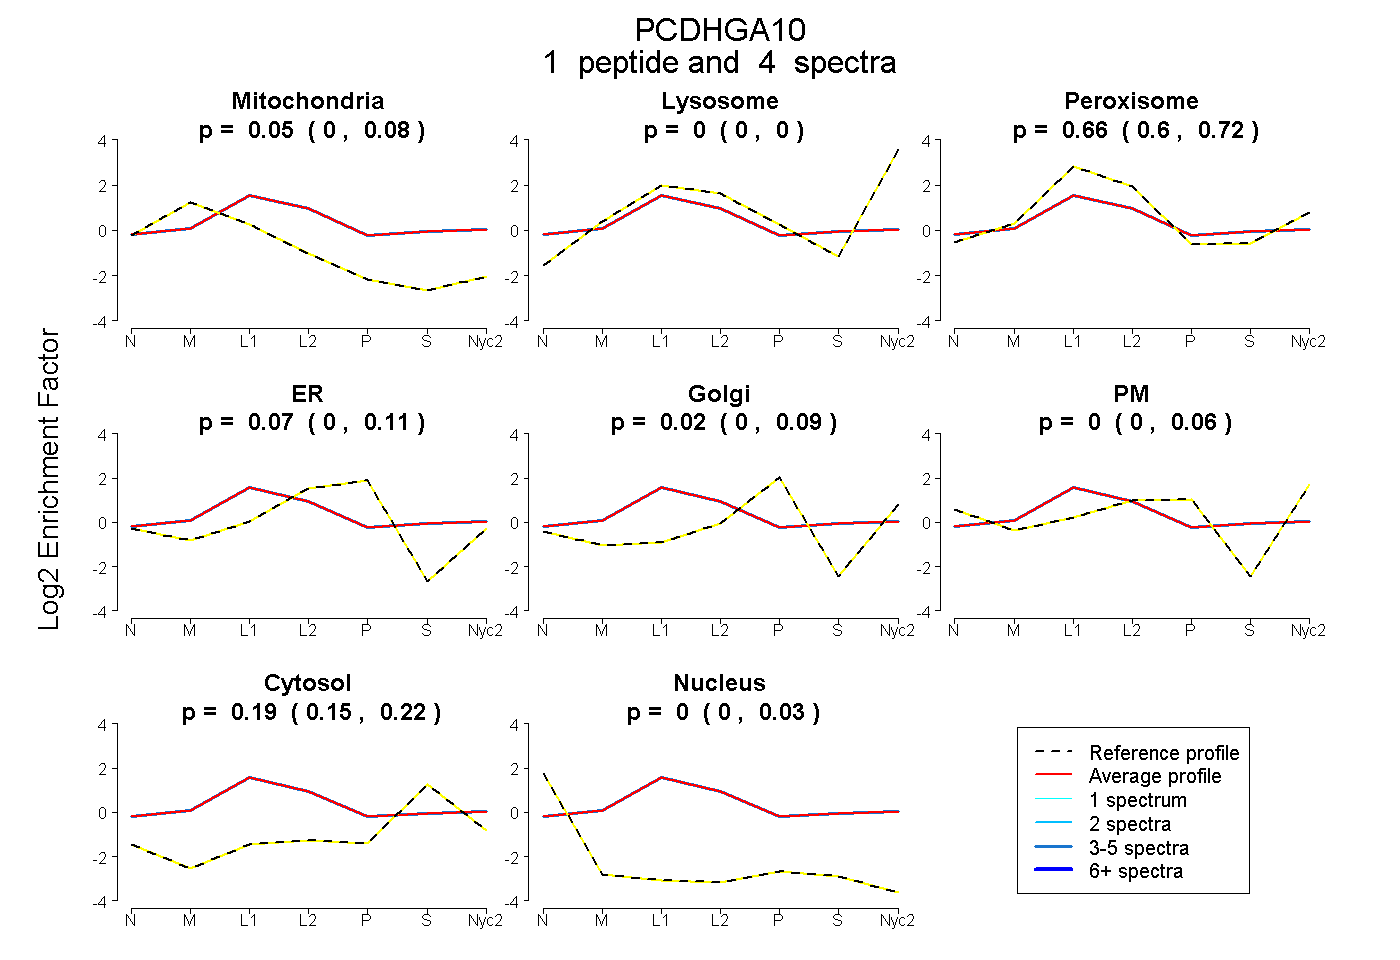
| Plot | Mito | Lyso | Perox | ER | Golgi | PM | Cytosol | Nucleus | |||||
| Expt A |
1 peptide |
4 spectra |
|
0.051 0.000 | 0.084 |
0.000 0.000 | 0.000 |
0.661 0.599 | 0.720 |
0.071 0.000 | 0.114 |
0.025 0.000 | 0.091 |
0.000 0.000 | 0.065 |
0.191 0.149 | 0.222 |
0.000 0.000 | 0.028 |
||
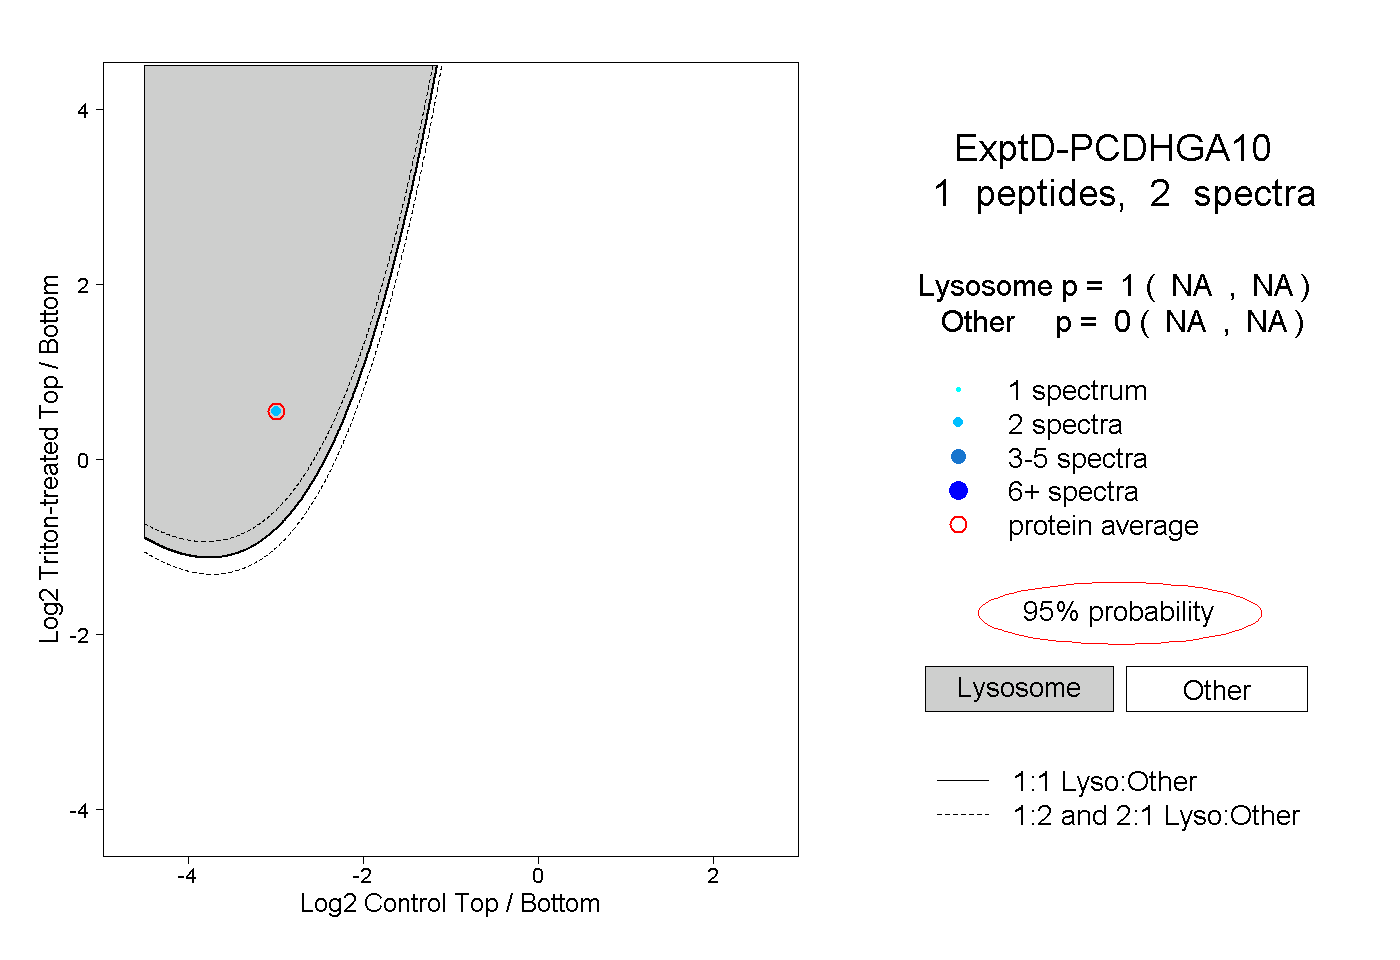
| Plot | Lyso | Other | |||||||||||
| Expt D |
1 peptide |
2 spectra |
|
1.000 NA | NA |
0.000 NA | NA |