5
5peptides
spectra
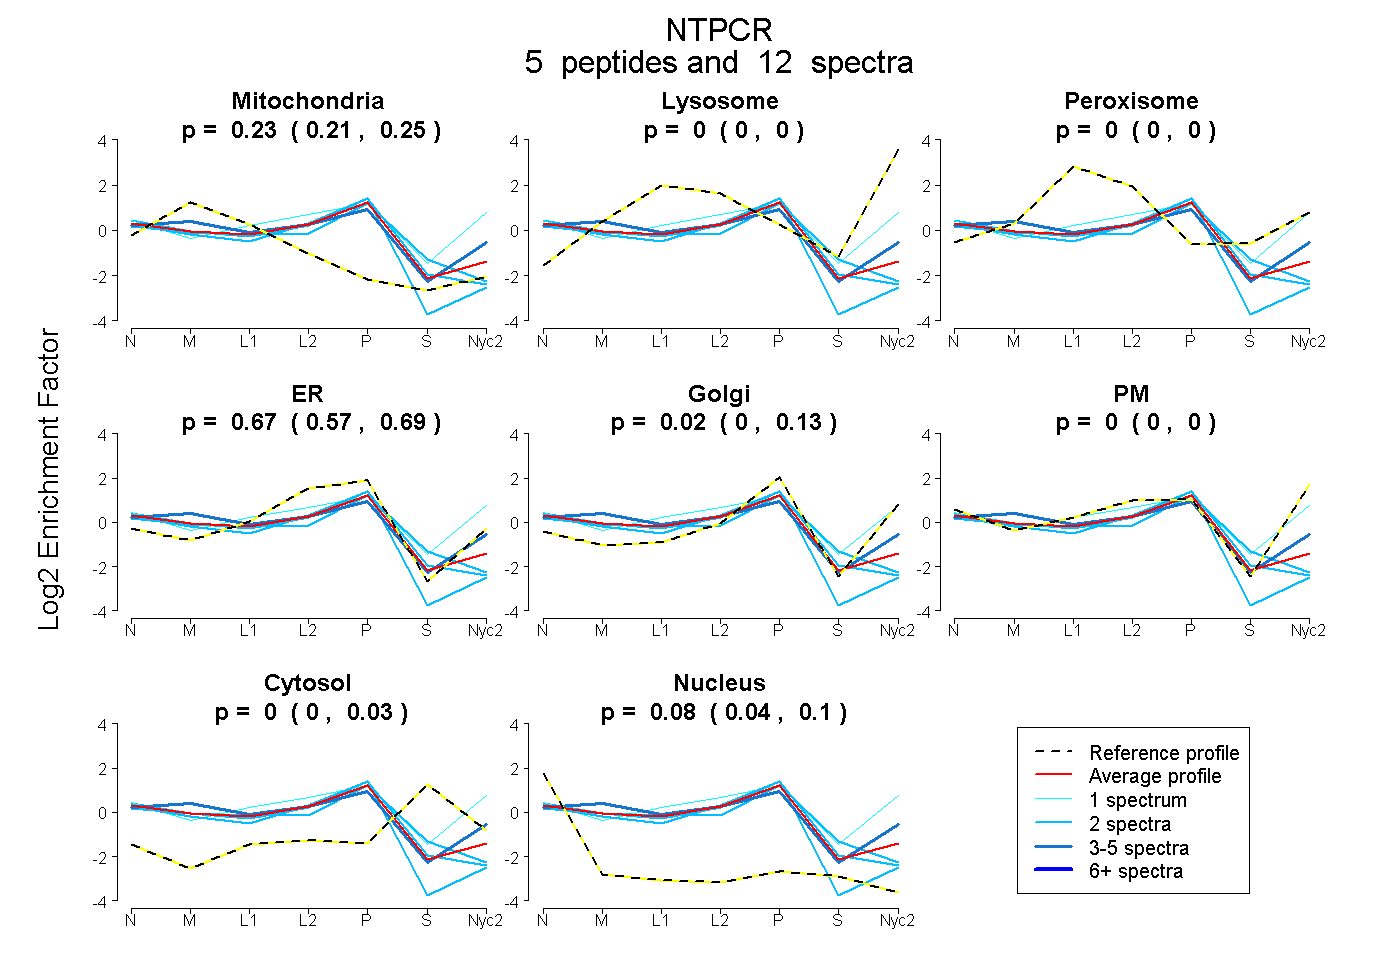
0.215 | 0.248
0.000 | 0.000
0.000 | 0.000
0.566 | 0.688
0.000 | 0.127
0.000 | 0.000
0.000 | 0.030
0.042 | 0.095
1peptide
spectrum
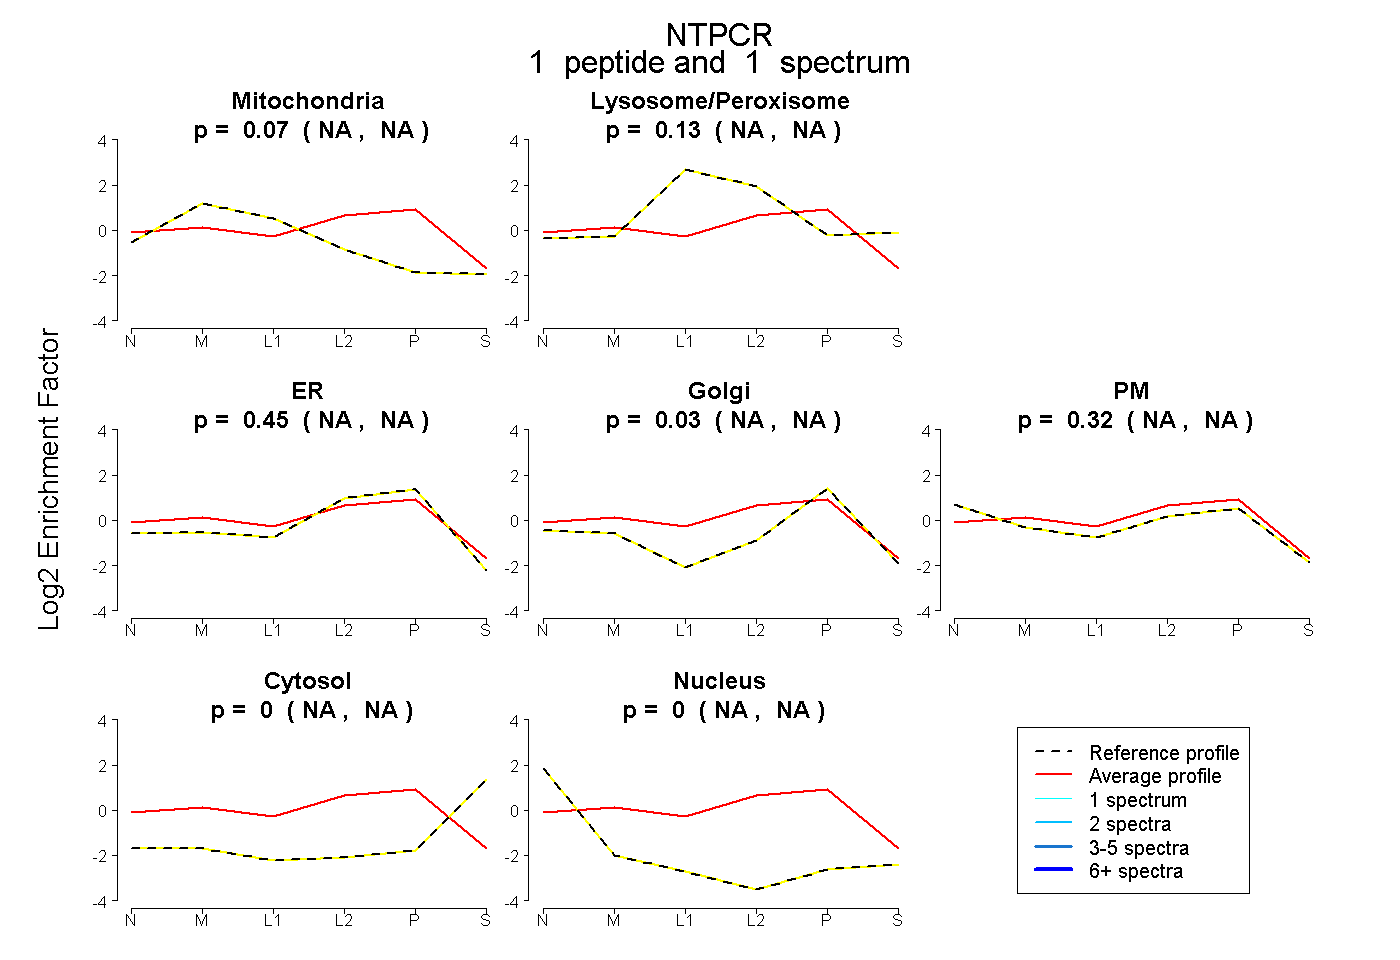
NA | NA
NA | NA
NA | NA
NA | NA
NA | NA
NA | NA
NA | NA
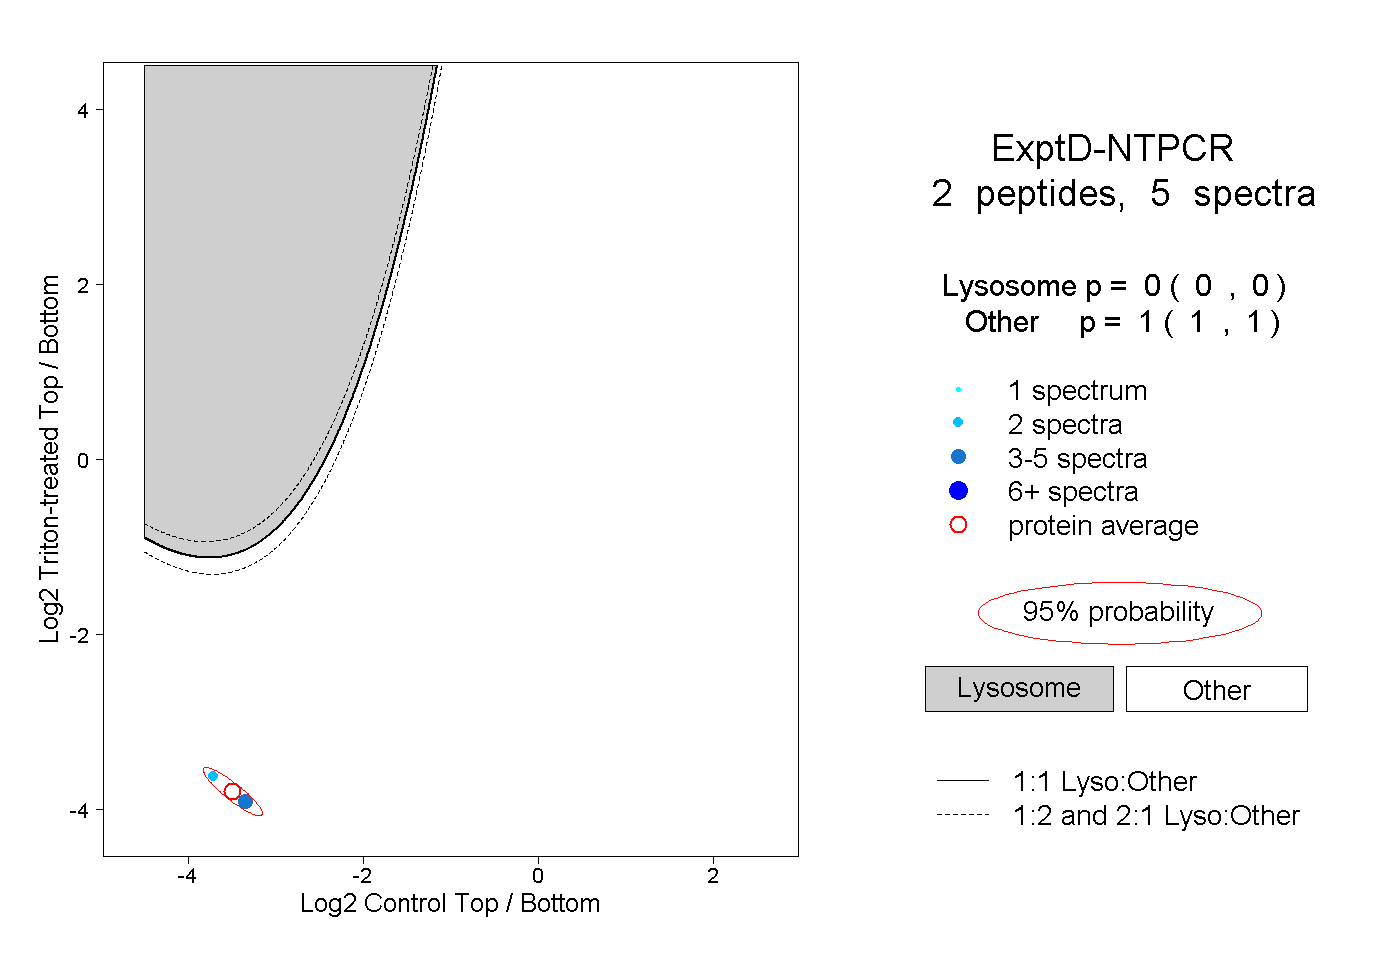
5peptides
spectra
0.000 | 0.000
1.000 | 1.000