 5
5peptides
spectra
0.215 | 0.248
0.000 | 0.000
0.000 | 0.000
0.566 | 0.688
0.000 | 0.127
0.000 | 0.000
0.000 | 0.030
0.042 | 0.095
| Plot | Mito | Lyso | Perox | ER | Golgi | PM | Cytosol | Nucleus | |||||
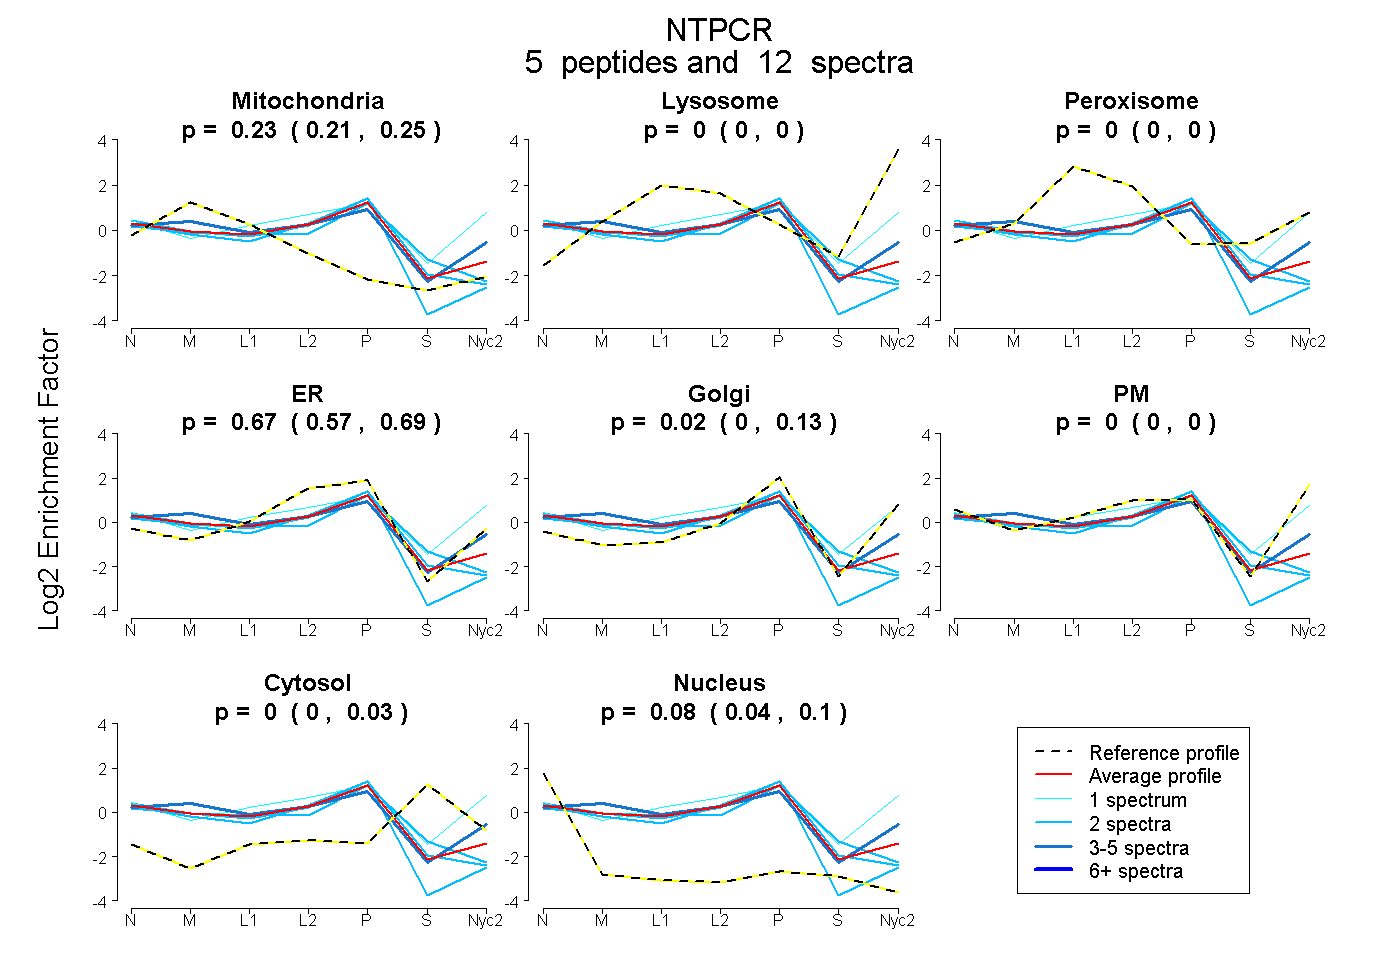
| Expt A |
5 peptides |
12 spectra |
|
0.232 0.215 | 0.248 |
0.000 0.000 | 0.000 |
0.000 0.000 | 0.000 |
0.666 0.566 | 0.688 |
0.024 0.000 | 0.127 |
0.000 0.000 | 0.000 |
0.000 0.000 | 0.030 |
0.078 0.042 | 0.095 |
| 2 spectra, VCVIDEVGK | 0.248 | 0.000 | 0.000 | 0.557 | 0.000 | 0.000 | 0.119 | 0.076 | ||
| 2 spectra, NAVPSCGLR | 0.167 | 0.000 | 0.000 | 0.674 | 0.000 | 0.000 | 0.000 | 0.159 | ||
| 1 spectrum, MELFSQPFIQAVR | 0.000 | 0.000 | 0.127 | 0.126 | 0.148 | 0.502 | 0.097 | 0.000 | ||
| 2 spectra, IGFDVVTLSGAQGPLSR | 0.202 | 0.000 | 0.000 | 0.648 | 0.000 | 0.000 | 0.000 | 0.150 | ||
| 5 spectra, VFSVTR | 0.314 | 0.000 | 0.000 | 0.369 | 0.173 | 0.144 | 0.000 | 0.000 |
| Plot | Mito | Lyso or Perox | ER | Golgi | PM | Cytosol | Nucleus | ||||||
| Expt B |
1 peptide |
1 spectrum |
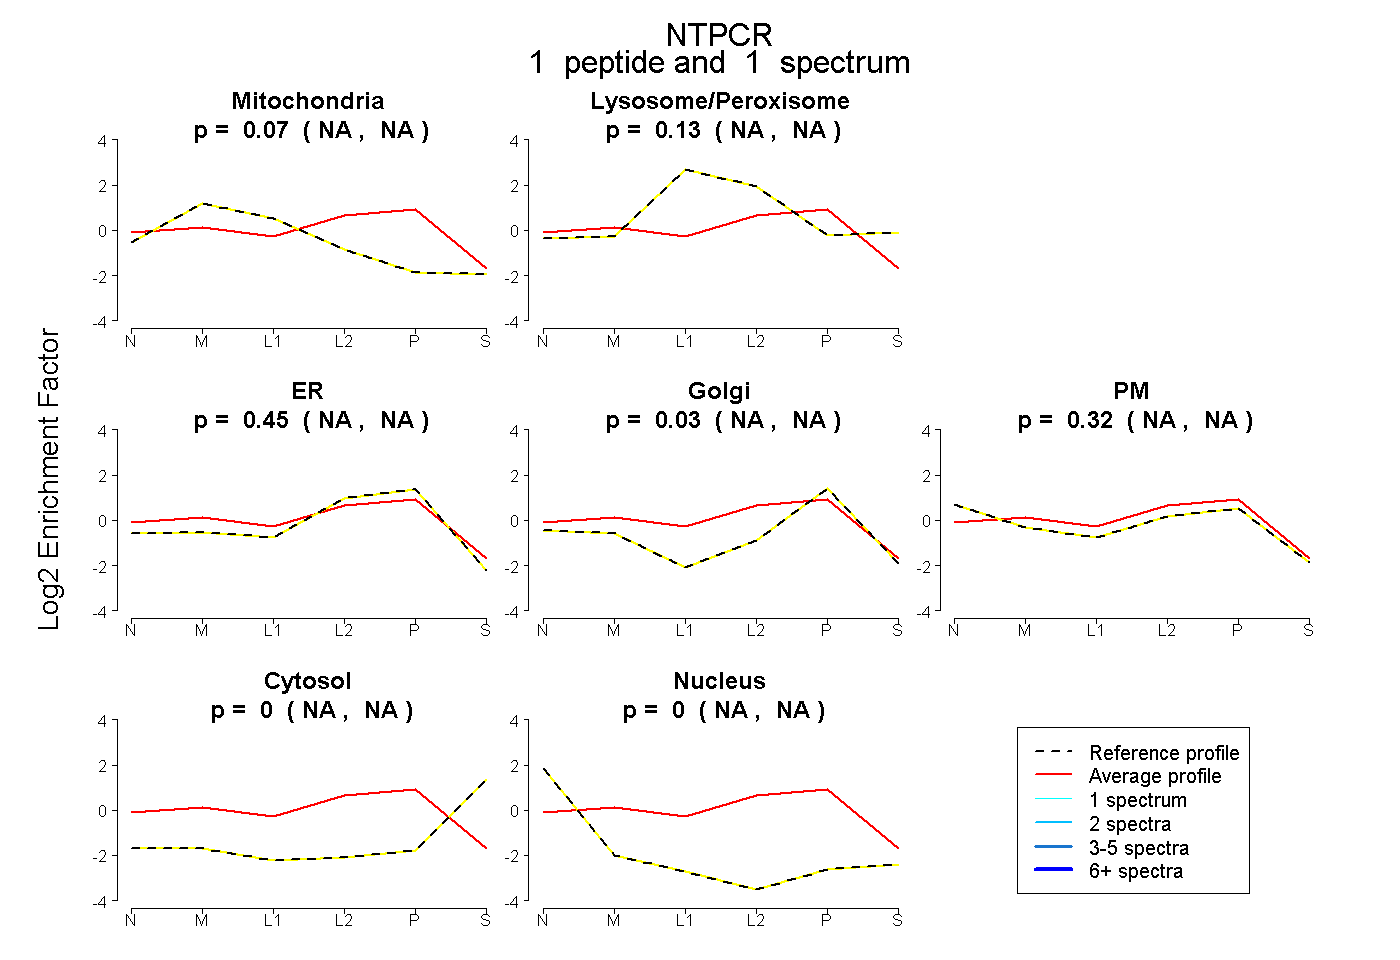 |
0.069 NA | NA |
0.128 NA | NA |
0.455 NA | NA |
0.031 NA | NA |
0.317 NA | NA |
0.000 NA | NA |
0.000 NA | NA |
|||
| Plot | Lyso | Other | |||||||||||
| Expt C |
5 peptides |
8 spectra |
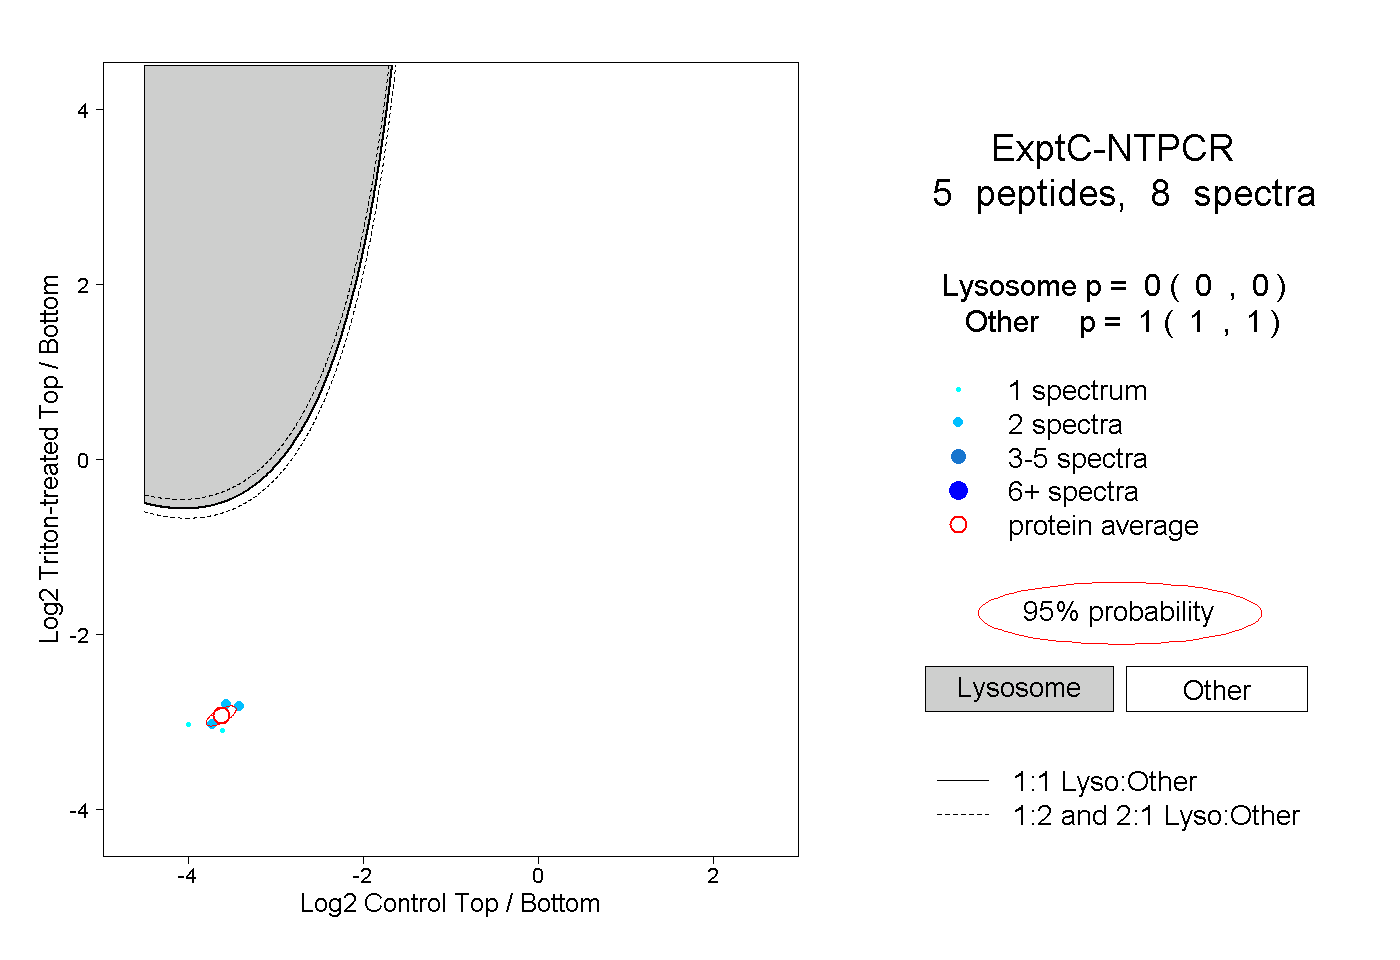 |
0.000 0.000 | 0.000 |
1.000 1.000 | 1.000 |
||||||||
| Plot | Lyso | Other | |||||||||||
| Expt D |
2 peptides |
5 spectra |
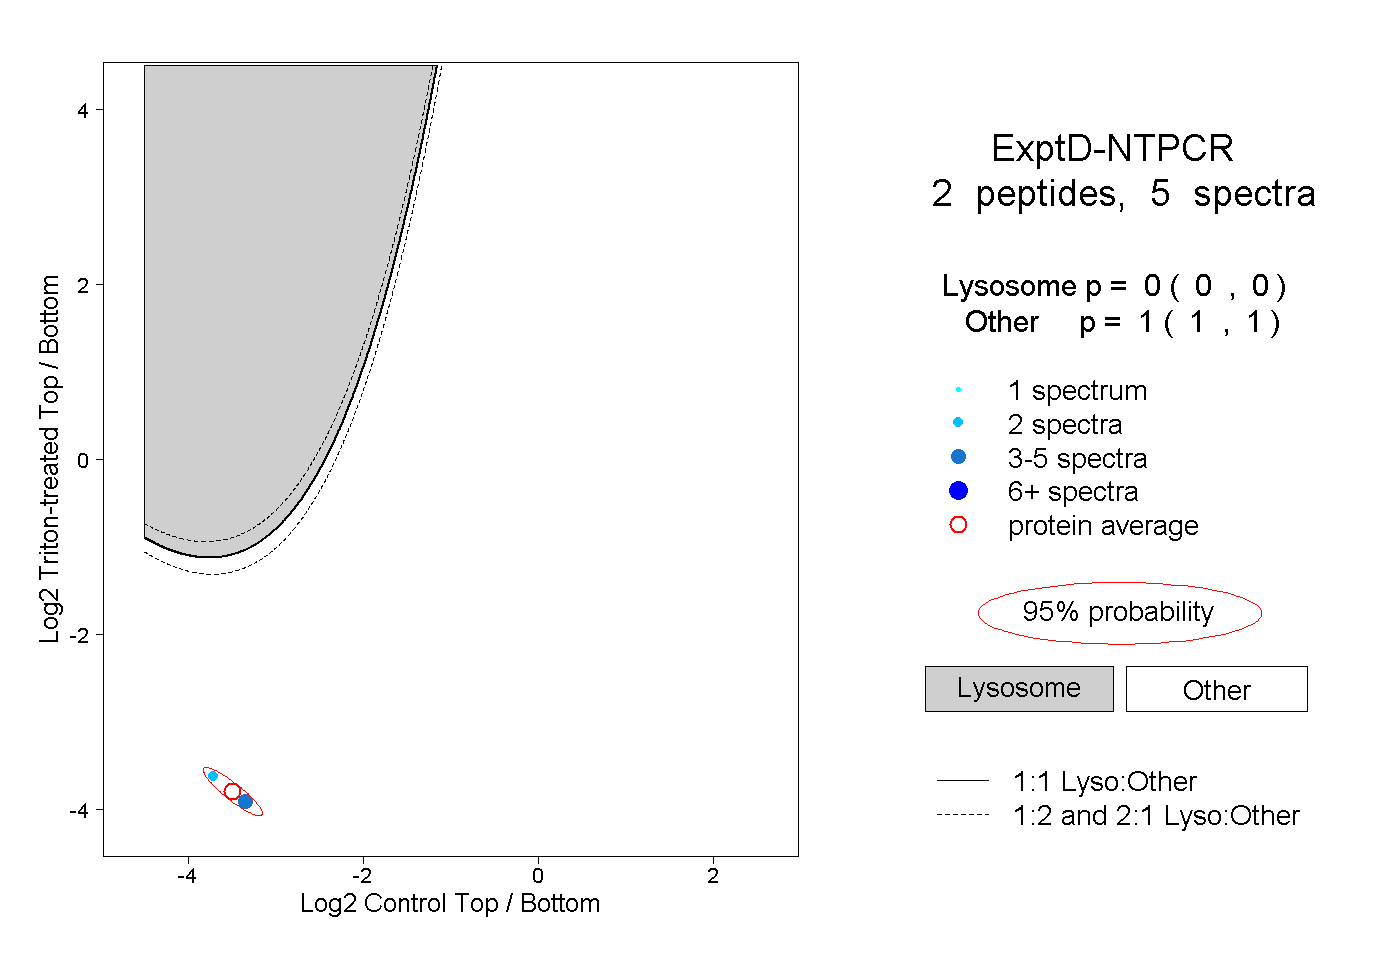 |
0.000 0.000 | 0.000 |
1.000 1.000 | 1.000 |