 5
5peptides
spectra
0.000 | 0.000
0.000 | 0.000
0.000 | 0.000
0.000 | 0.000
0.000 | 0.000
0.000 | 0.000
0.915 | 0.953
0.044 | 0.081
2peptides
spectra
NA | NA
NA | NA
NA | NA
NA | NA
NA | NA
NA | NA
NA | NA
| Plot | Mito | Lyso | Perox | ER | Golgi | PM | Cytosol | Nucleus | |||||
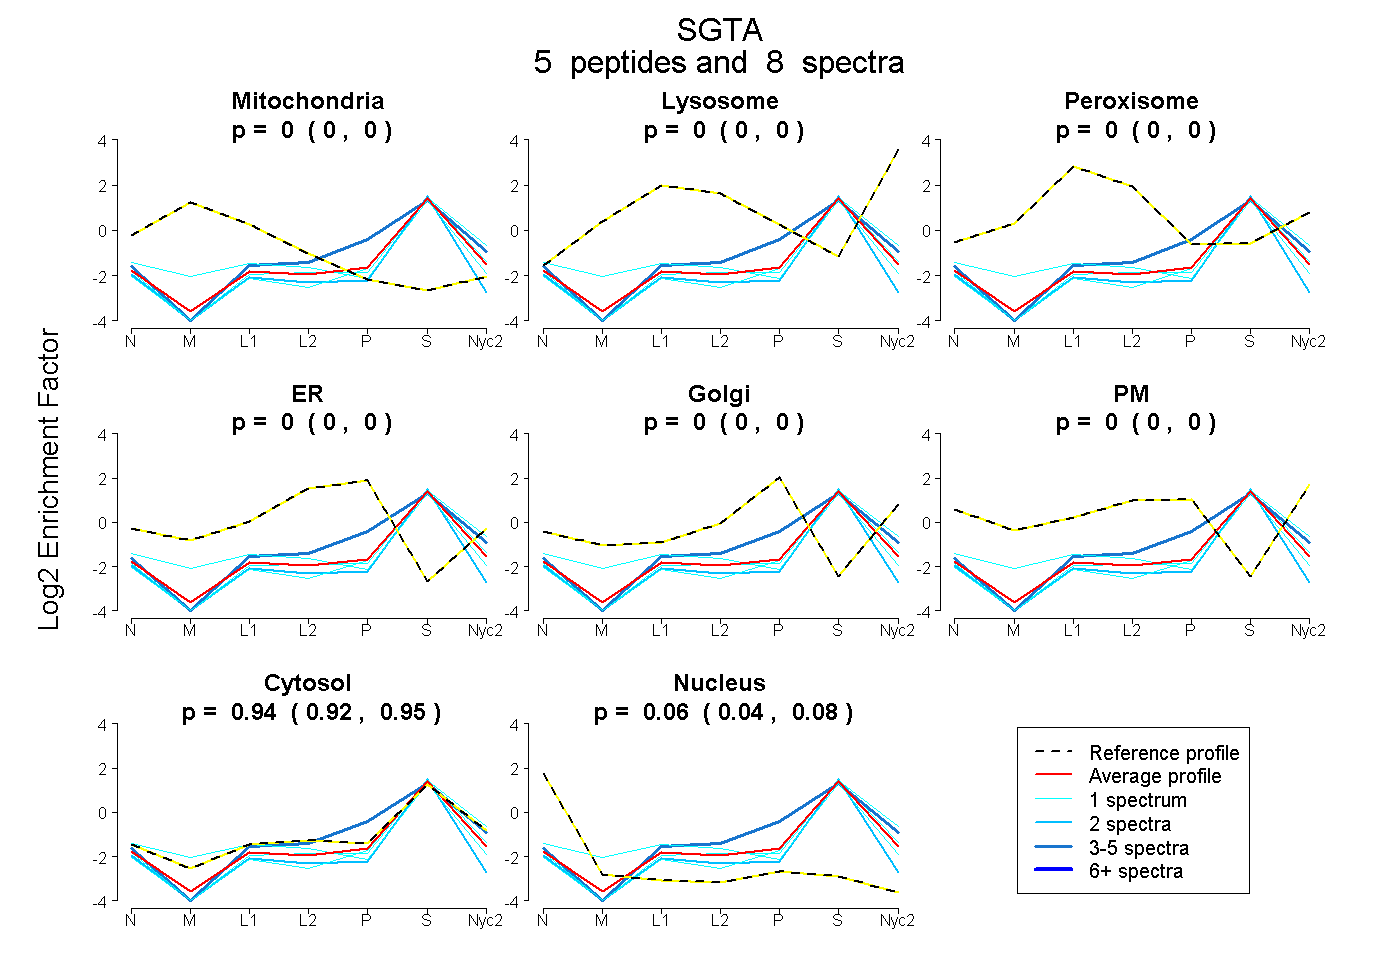
| Expt A |
5 peptides |
8 spectra |
|
0.000 0.000 | 0.000 |
0.000 0.000 | 0.000 |
0.000 0.000 | 0.000 |
0.000 0.000 | 0.000 |
0.000 0.000 | 0.000 |
0.000 0.000 | 0.000 |
0.937 0.915 | 0.953 |
0.063 0.044 | 0.081 |
||
| Plot | Mito | Lyso or Perox | ER | Golgi | PM | Cytosol | Nucleus | ||||||
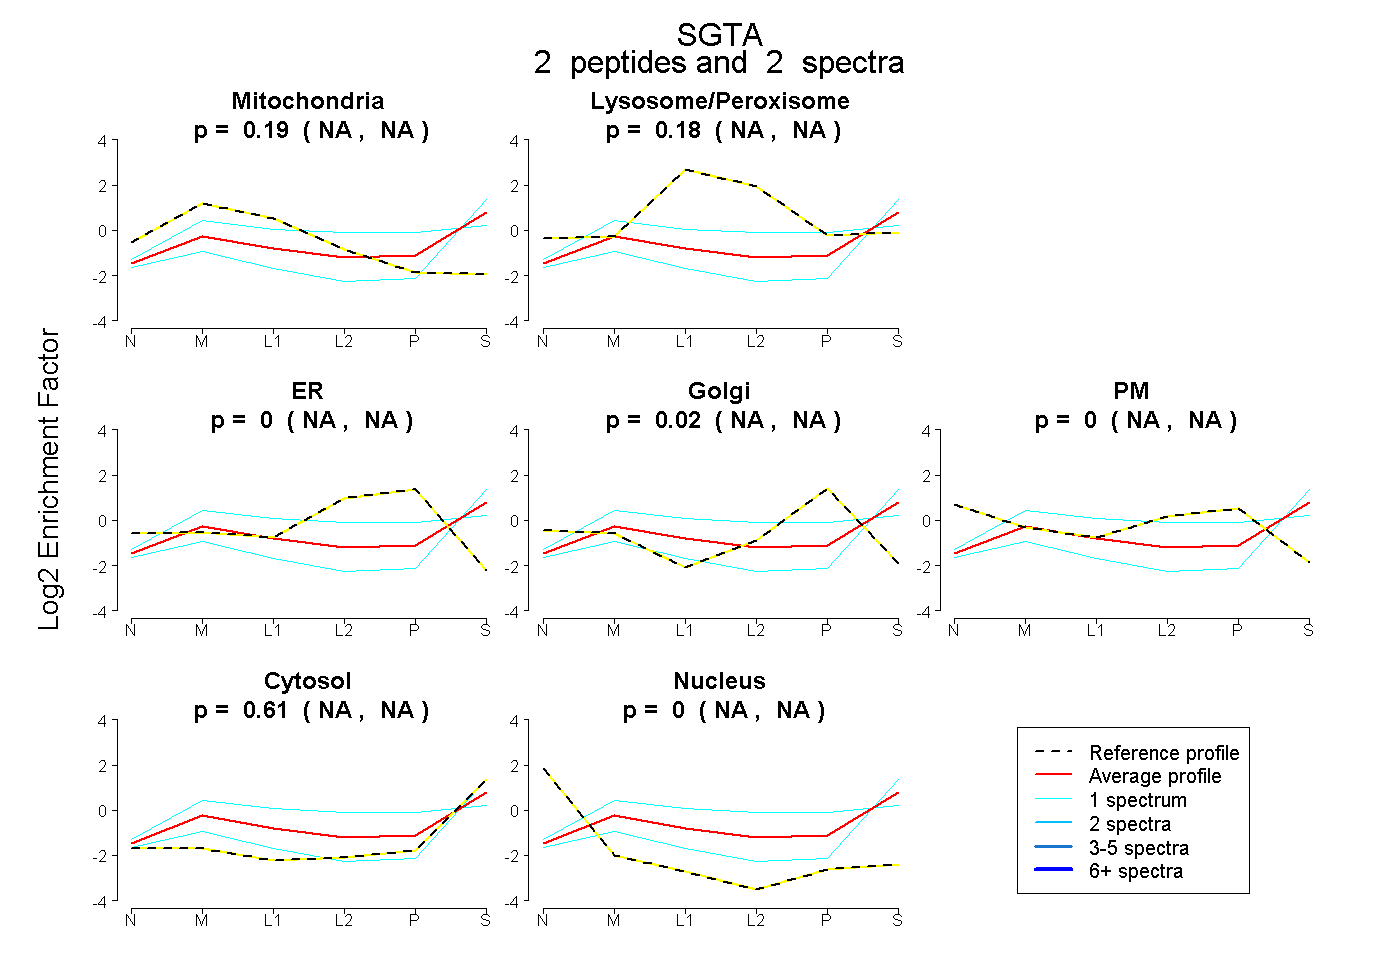
| Expt B |
2 peptides |
2 spectra |
|
0.191 NA | NA |
0.180 NA | NA |
0.000 NA | NA |
0.021 NA | NA |
0.000 NA | NA |
0.609 NA | NA |
0.000 NA | NA |
| 1 spectrum, LGNYVGAVQDCER | 0.117 | 0.000 | 0.000 | 0.000 | 0.000 | 0.883 | 0.000 | |||
| 1 spectrum, AIELNPANAVYFCNR | 0.144 | 0.392 | 0.000 | 0.196 | 0.000 | 0.267 | 0.000 |
| Plot | Lyso | Other | |||||||||||
| Expt C |
5 peptides |
7 spectra |
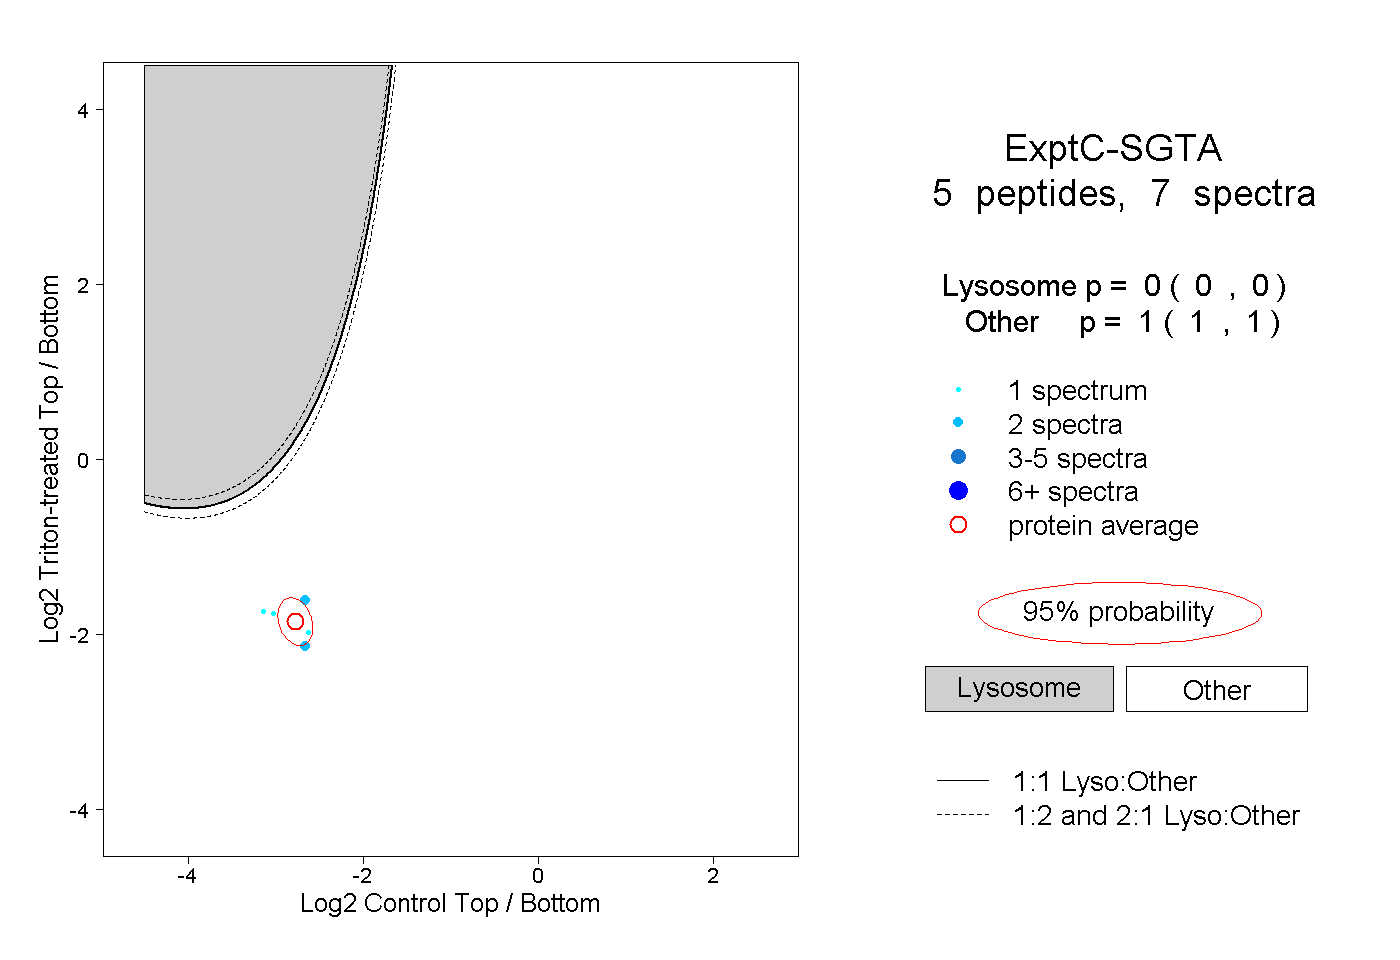 |
0.000 0.000 | 0.000 |
1.000 1.000 | 1.000 |