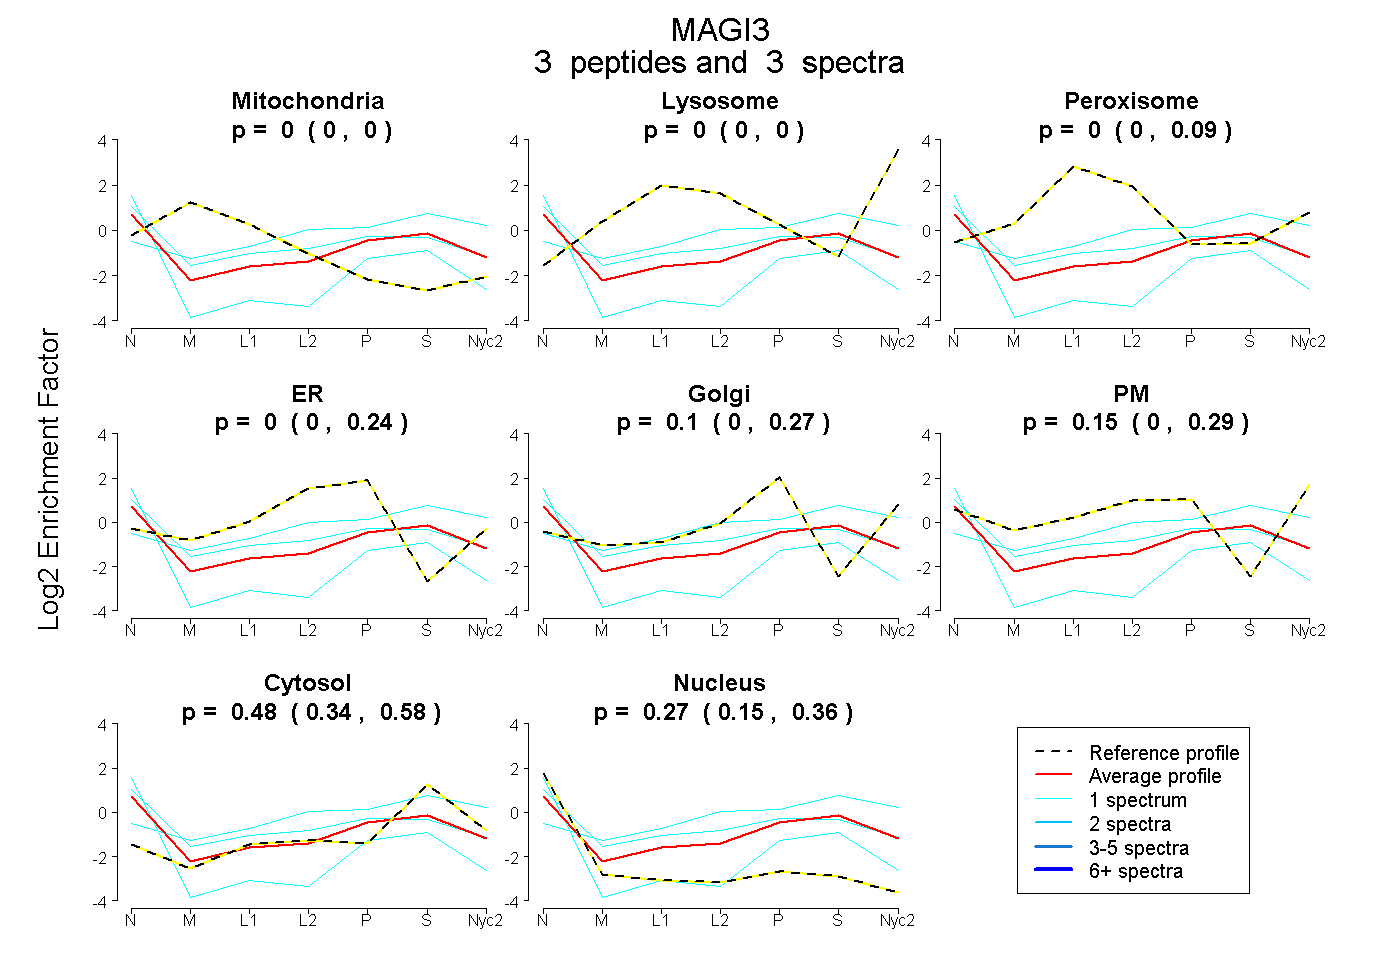
 3
3peptides
spectra
0.000 | 0.000
0.000 | 0.000
0.000 | 0.088
0.000 | 0.245
0.000 | 0.268
0.000 | 0.294
0.337 | 0.578
0.146 | 0.364
1peptide
spectrum
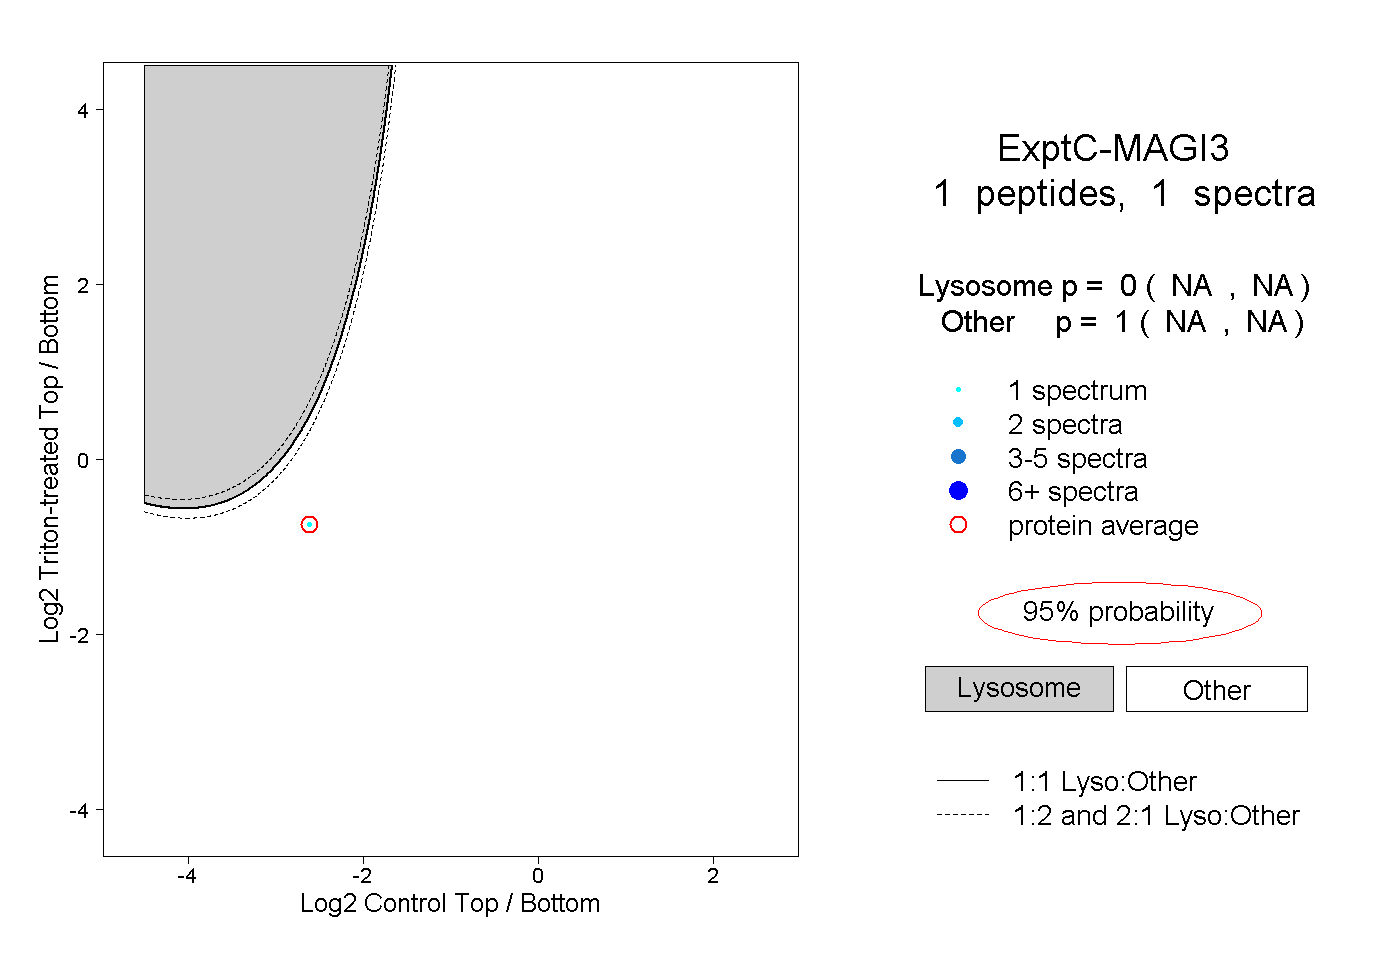
NA | NA
NA | NA
| Plot | Mito | Lyso | Perox | ER | Golgi | PM | Cytosol | Nucleus | |||||
| Expt A |
3 peptides |
3 spectra |
|
0.000 0.000 | 0.000 |
0.000 0.000 | 0.000 |
0.000 0.000 | 0.088 |
0.000 0.000 | 0.245 |
0.098 0.000 | 0.268 |
0.153 0.000 | 0.294 |
0.480 0.337 | 0.578 |
0.270 0.146 | 0.364 |
||
| Plot | Lyso | Other | |||||||||||
| Expt C |
1 peptide |
1 spectrum |
|
0.000 NA | NA |
1.000 NA | NA |