 23
23peptides
spectra
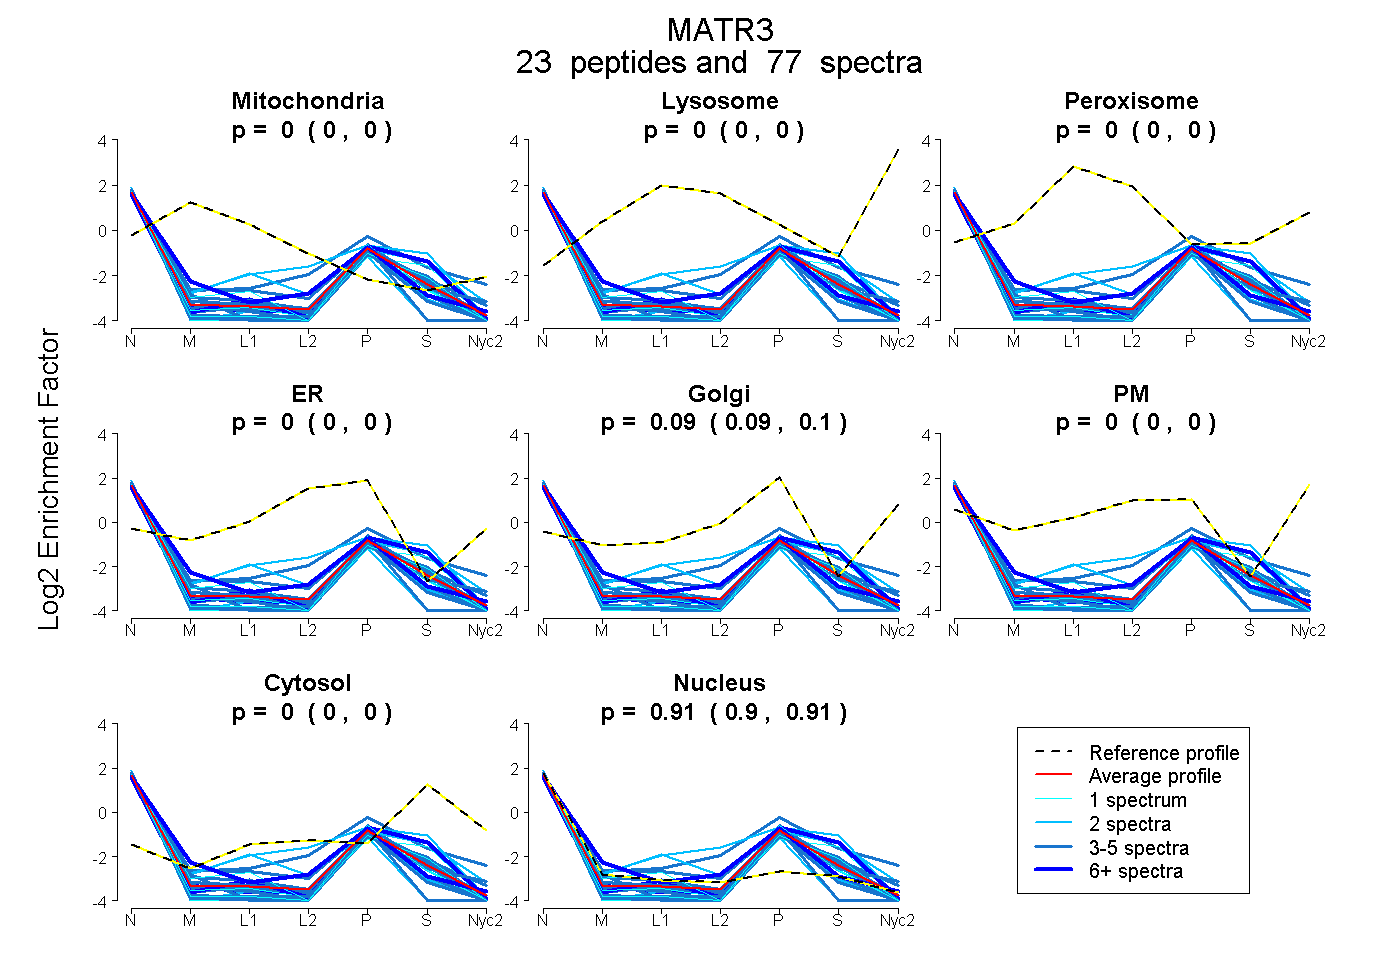
0.000 | 0.000
0.000 | 0.000
0.000 | 0.000
0.000 | 0.000
0.092 | 0.096
0.000 | 0.000
0.000 | 0.000
0.904 | 0.908
7peptides
spectra
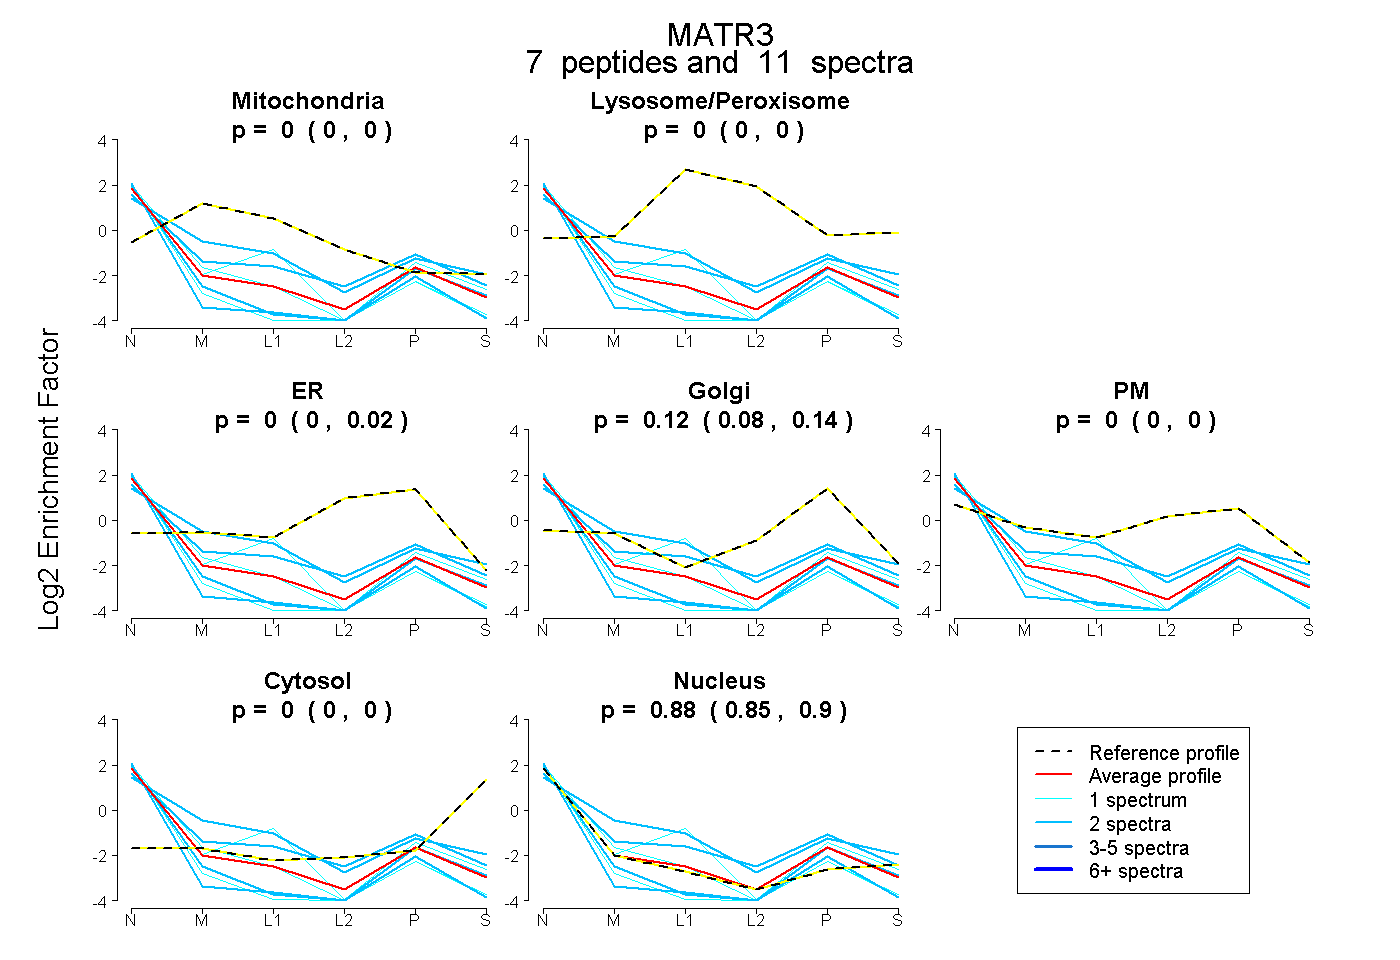
0.000 | 0.000
0.000 | 0.000
0.000 | 0.019
0.076 | 0.140
0.000 | 0.000
0.000 | 0.000
0.852 | 0.900
2peptides
spectra
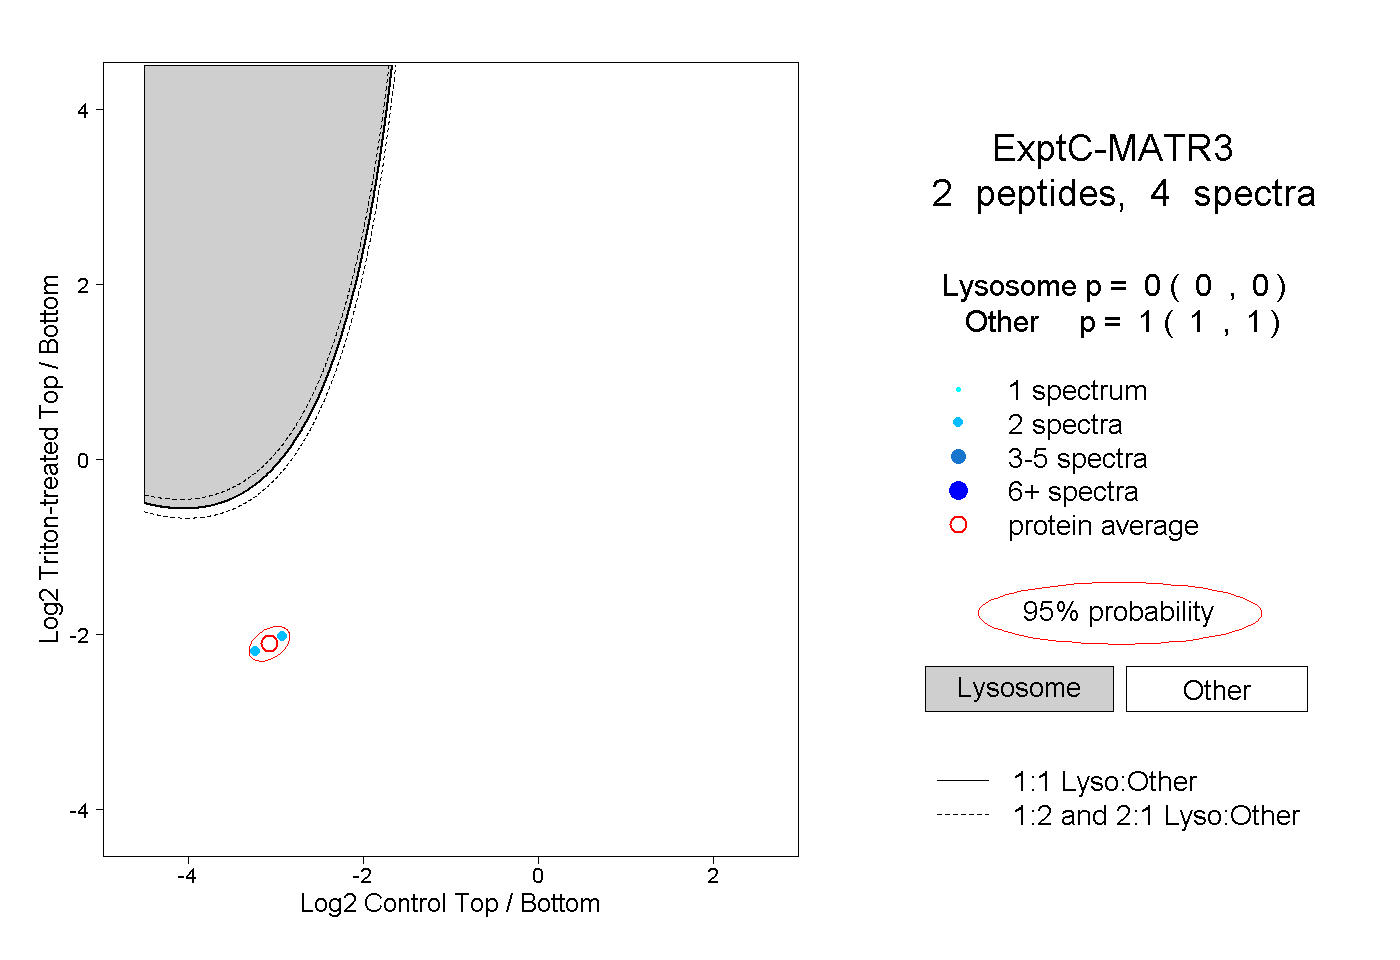
0.000 | 0.000
1.000 | 1.000