 4
4peptides
spectra
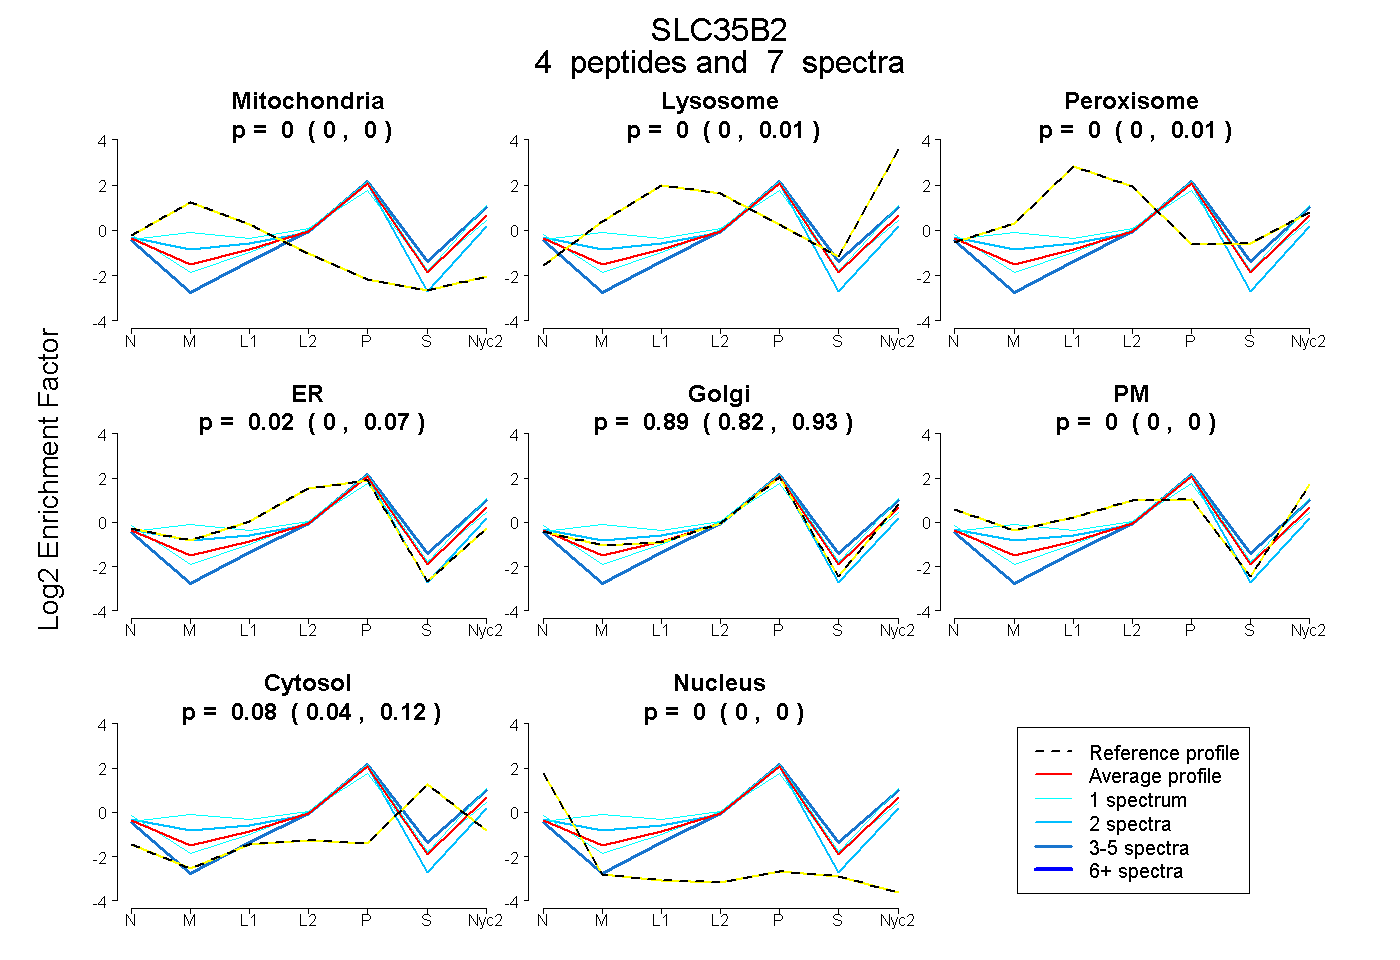
0.000 | 0.000
0.000 | 0.007
0.000 | 0.009
0.000 | 0.068
0.821 | 0.934
0.000 | 0.000
0.042 | 0.116
0.000 | 0.000
| Plot | Mito | Lyso | Perox | ER | Golgi | PM | Cytosol | Nucleus | |||||
| Expt A |
4 peptides |
7 spectra |
|
0.000 0.000 | 0.000 |
0.000 0.000 | 0.007 |
0.000 0.000 | 0.009 |
0.023 0.000 | 0.068 |
0.894 0.821 | 0.934 |
0.000 0.000 | 0.000 |
0.083 0.042 | 0.116 |
0.000 0.000 | 0.000 |
| 1 spectrum, AVPTEPAVQK | 0.000 | 0.000 | 0.000 | 0.060 | 0.829 | 0.000 | 0.111 | 0.000 | ||
| 2 spectra, ACVFGNEPK | 0.042 | 0.000 | 0.000 | 0.182 | 0.757 | 0.000 | 0.000 | 0.019 | ||
| 3 spectra, APDEVPLAPR | 0.000 | 0.000 | 0.000 | 0.000 | 0.819 | 0.000 | 0.181 | 0.000 | ||
| 1 spectrum, FVSFPTQVLAK | 0.056 | 0.164 | 0.024 | 0.000 | 0.756 | 0.000 | 0.000 | 0.000 |
| Plot | Lyso | Other | |||||||||||
| Expt C |
5 peptides |
14 spectra |
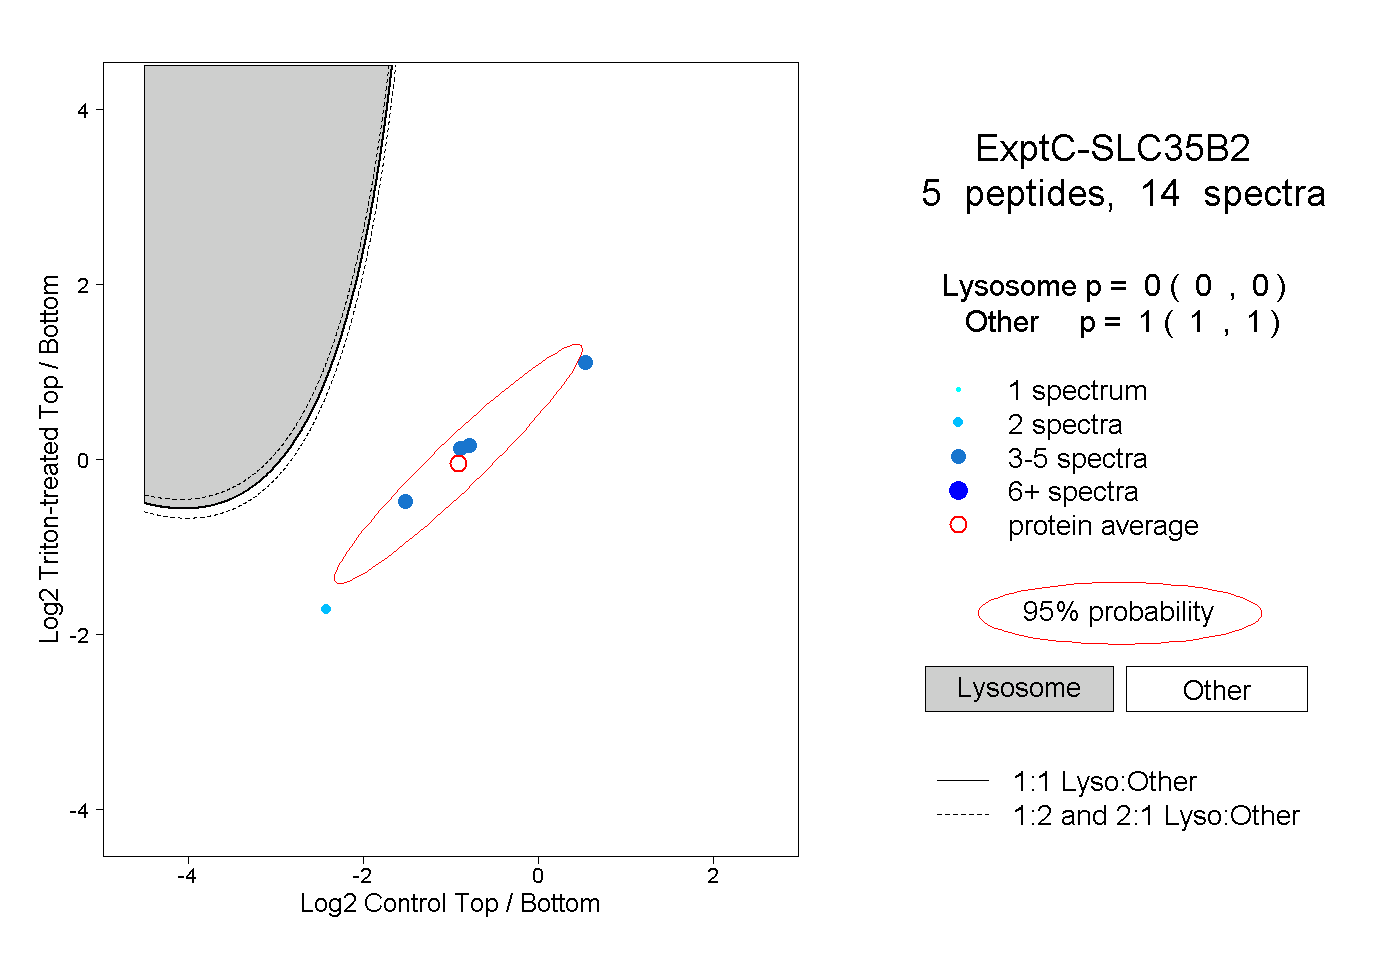 |
0.000 0.000 | 0.000 |
1.000 1.000 | 1.000 |