8
8peptides
spectra
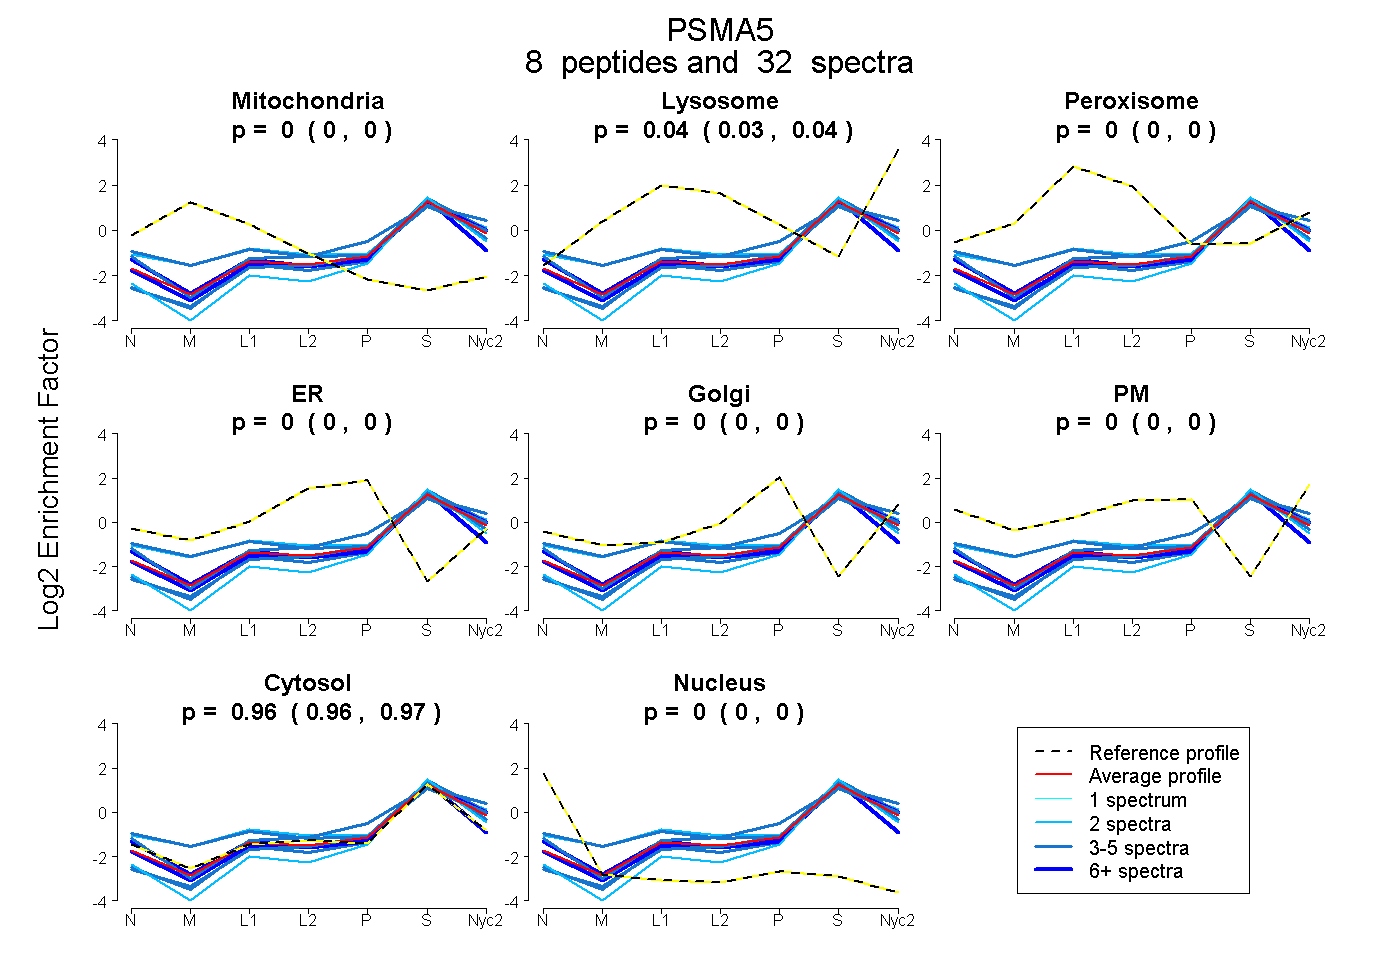
0.000 | 0.000
0.028 | 0.042
0.000 | 0.000
0.000 | 0.000
0.000 | 0.000
0.000 | 0.000
0.957 | 0.971
0.000 | 0.000
7peptides
spectra
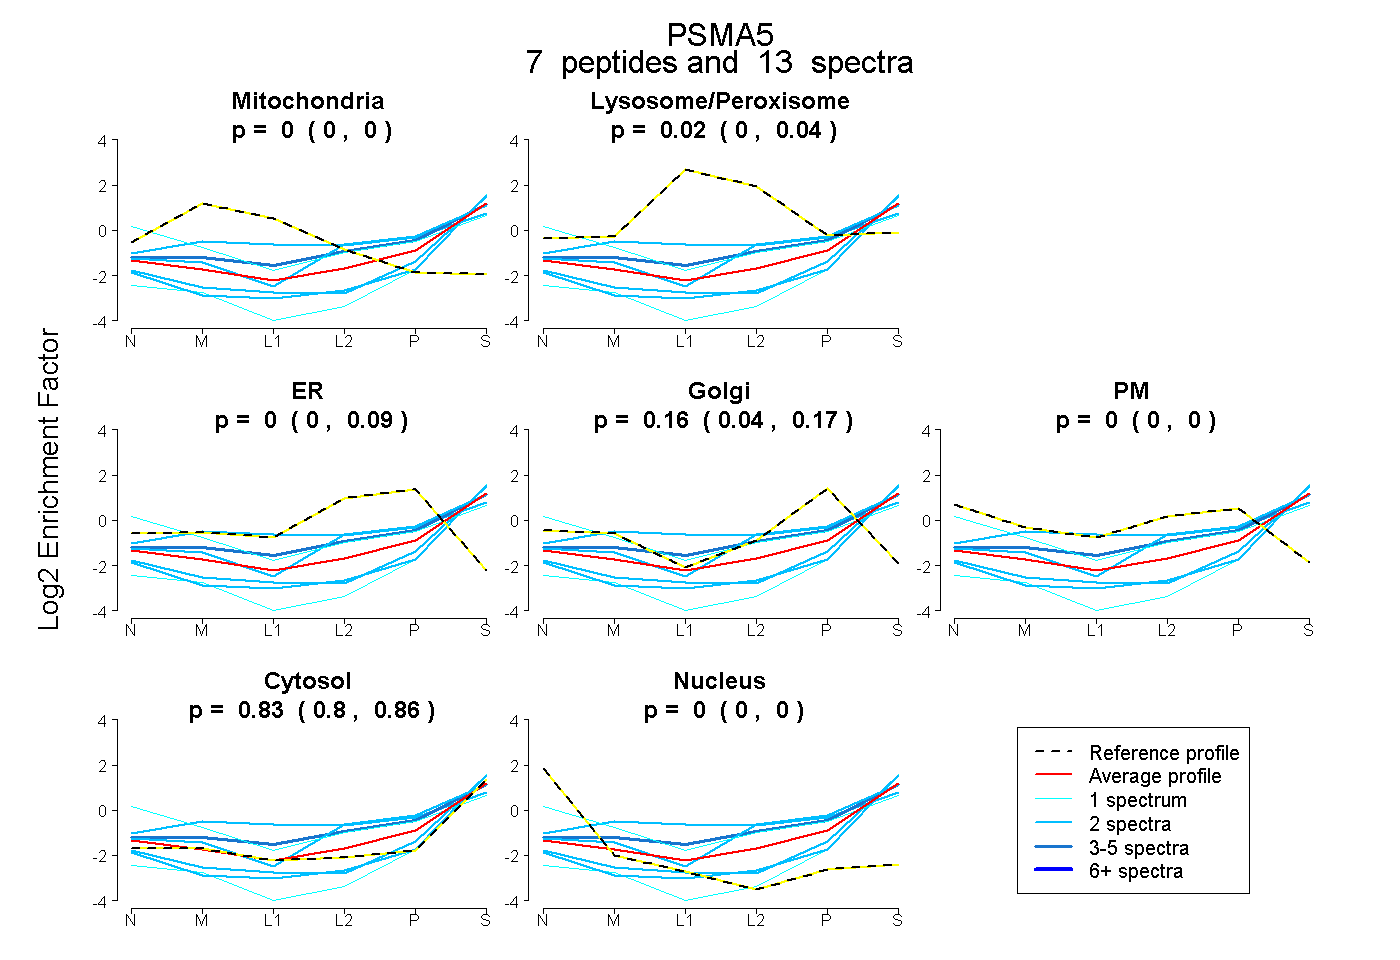
0.000 | 0.000
0.000 | 0.043
0.000 | 0.092
0.042 | 0.175
0.000 | 0.000
0.801 | 0.856
0.000 | 0.000