 8
8peptides
spectra
0.000 | 0.000
0.028 | 0.042
0.000 | 0.000
0.000 | 0.000
0.000 | 0.000
0.000 | 0.000
0.957 | 0.971
0.000 | 0.000
| Plot | Mito | Lyso | Perox | ER | Golgi | PM | Cytosol | Nucleus | |||||
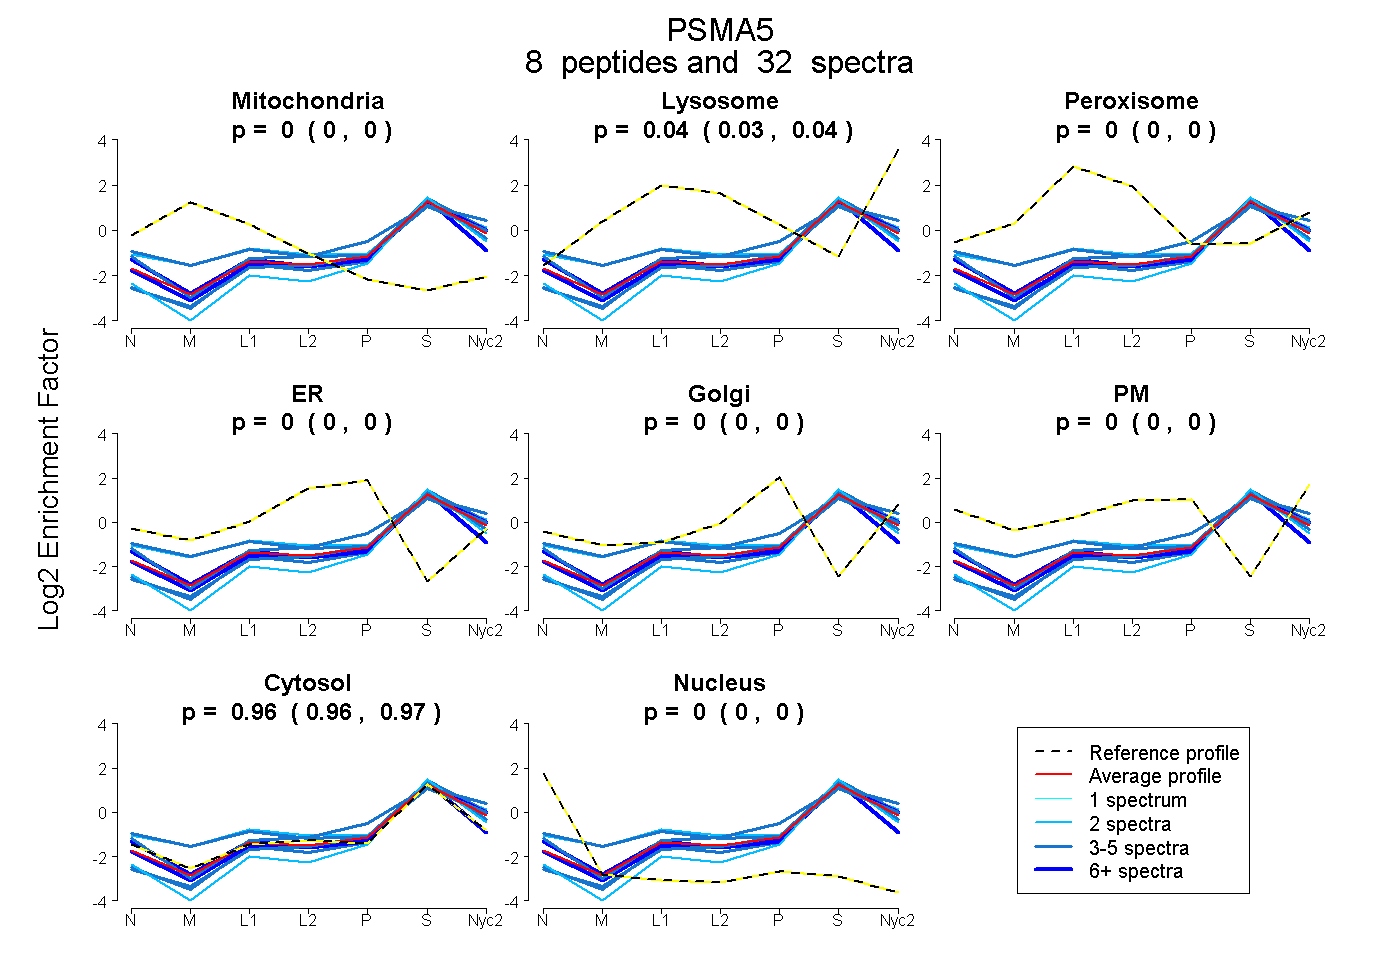
| Expt A |
8 peptides |
32 spectra |
|
0.000 0.000 | 0.000 |
0.036 0.028 | 0.042 |
0.000 0.000 | 0.000 |
0.000 0.000 | 0.000 |
0.000 0.000 | 0.000 |
0.000 0.000 | 0.000 |
0.964 0.957 | 0.971 |
0.000 0.000 | 0.000 |
| 5 spectra, LFQVEYAIEAIK | 0.000 | 0.000 | 0.000 | 0.000 | 0.000 | 0.000 | 1.000 | 0.000 | ||
| 4 spectra, SSLIILK | 0.041 | 0.147 | 0.000 | 0.000 | 0.000 | 0.017 | 0.796 | 0.000 | ||
| 2 spectra, AIGSASEGAQSSLQEVYHK | 0.018 | 0.183 | 0.000 | 0.000 | 0.000 | 0.000 | 0.799 | 0.000 | ||
| 2 spectra, LNATNIELATVQPGQNFHMFTK | 0.000 | 0.000 | 0.000 | 0.000 | 0.000 | 0.000 | 1.000 | 0.000 | ||
| 3 spectra, QVMEEK | 0.000 | 0.069 | 0.000 | 0.000 | 0.101 | 0.000 | 0.831 | 0.000 | ||
| 6 spectra, GPQLFHMDPSGTFVQCDAR | 0.000 | 0.000 | 0.000 | 0.000 | 0.000 | 0.000 | 1.000 | 0.000 | ||
| 7 spectra, ITSPLMEPSSIEK | 0.000 | 0.049 | 0.000 | 0.000 | 0.000 | 0.000 | 0.951 | 0.000 | ||
| 3 spectra, EELEEVIK | 0.000 | 0.000 | 0.000 | 0.000 | 0.000 | 0.000 | 1.000 | 0.000 |
| Plot | Mito | Lyso or Perox | ER | Golgi | PM | Cytosol | Nucleus | ||||||
| Expt B |
7 peptides |
13 spectra |
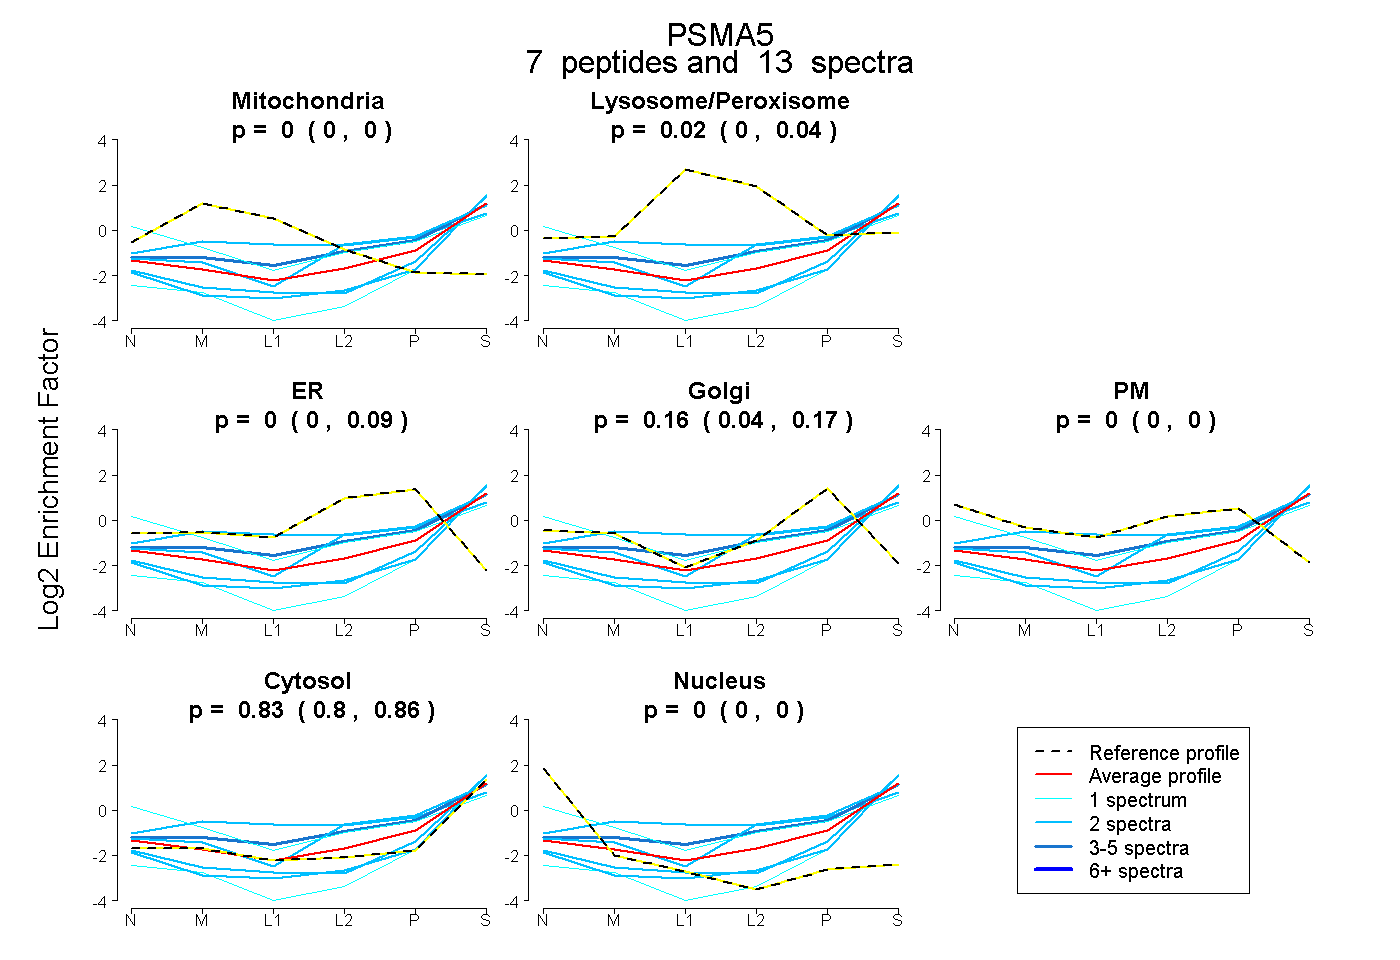 |
0.000 0.000 | 0.000 |
0.015 0.000 | 0.043 |
0.000 0.000 | 0.092 |
0.156 0.042 | 0.175 |
0.000 0.000 | 0.000 |
0.829 0.801 | 0.856 |
0.000 0.000 | 0.000 |
|||
| Plot | Lyso | Other | |||||||||||
| Expt C |
7 peptides |
58 spectra |
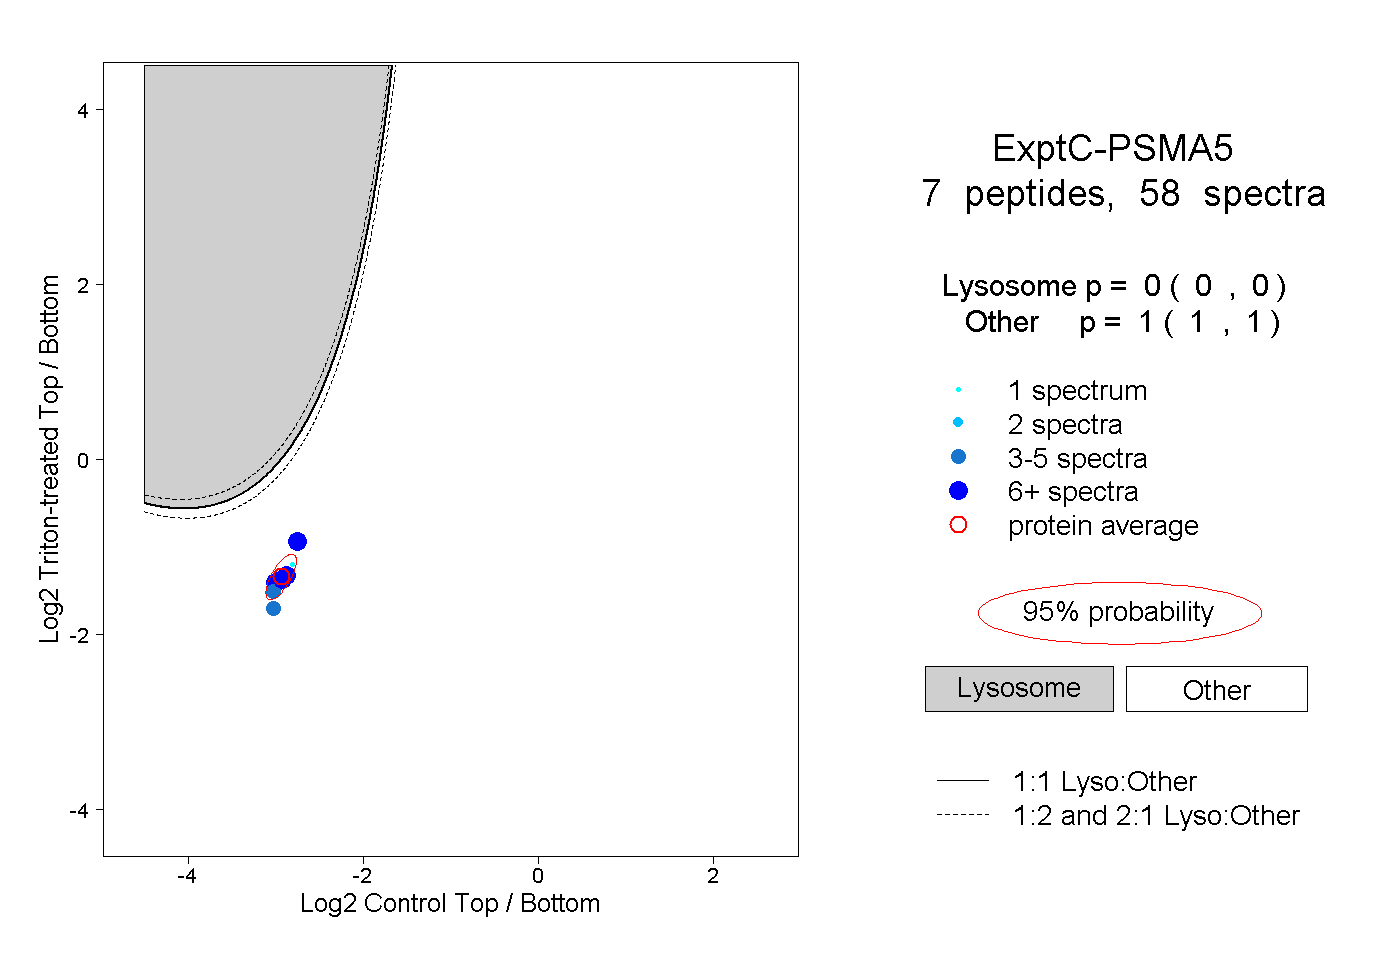 |
0.000 0.000 | 0.000 |
1.000 1.000 | 1.000 |
||||||||
| Plot | Lyso | Other | |||||||||||
| Expt D |
2 peptides |
3 spectra |
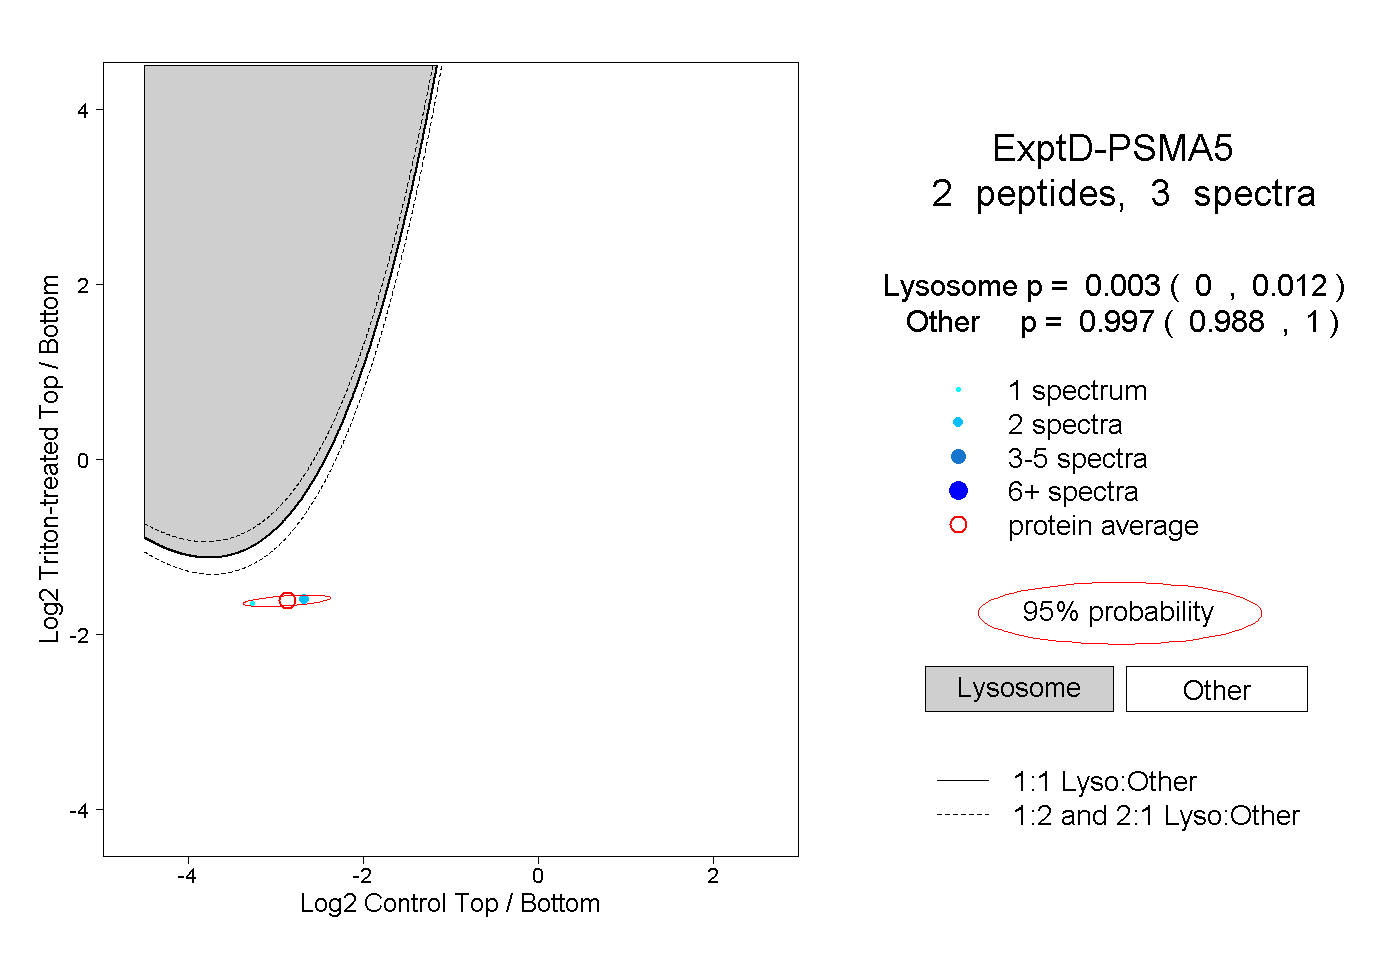 |
0.003 0.000 | 0.012 |
0.997 0.988 | 1.000 |