 30
30peptides
spectra
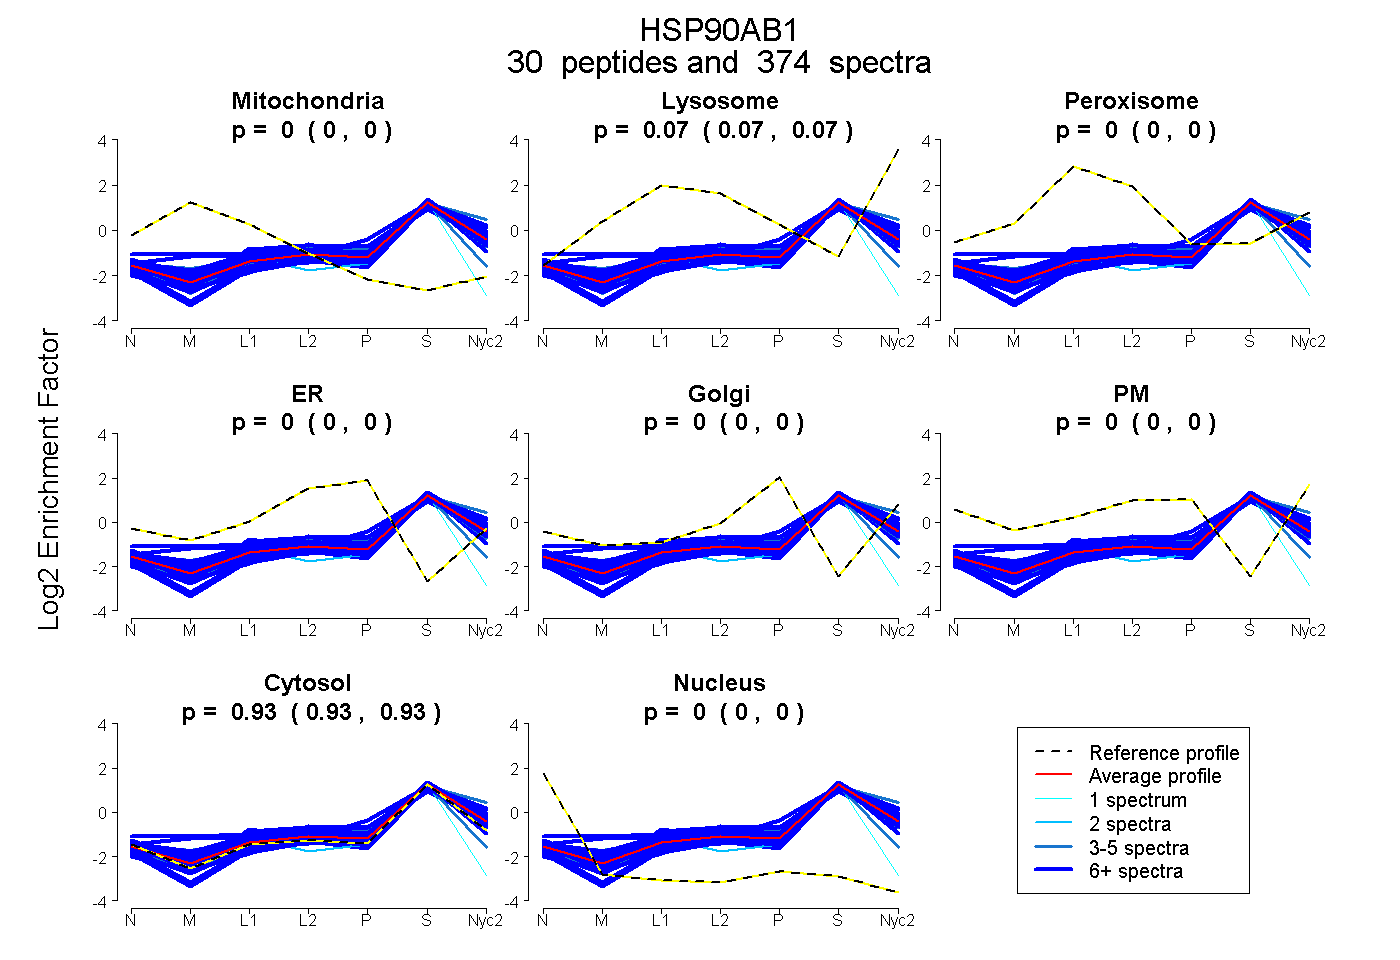
0.000 | 0.000
0.065 | 0.067
0.000 | 0.000
0.000 | 0.000
0.000 | 0.000
0.000 | 0.000
0.933 | 0.935
0.000 | 0.000
13peptides
spectra
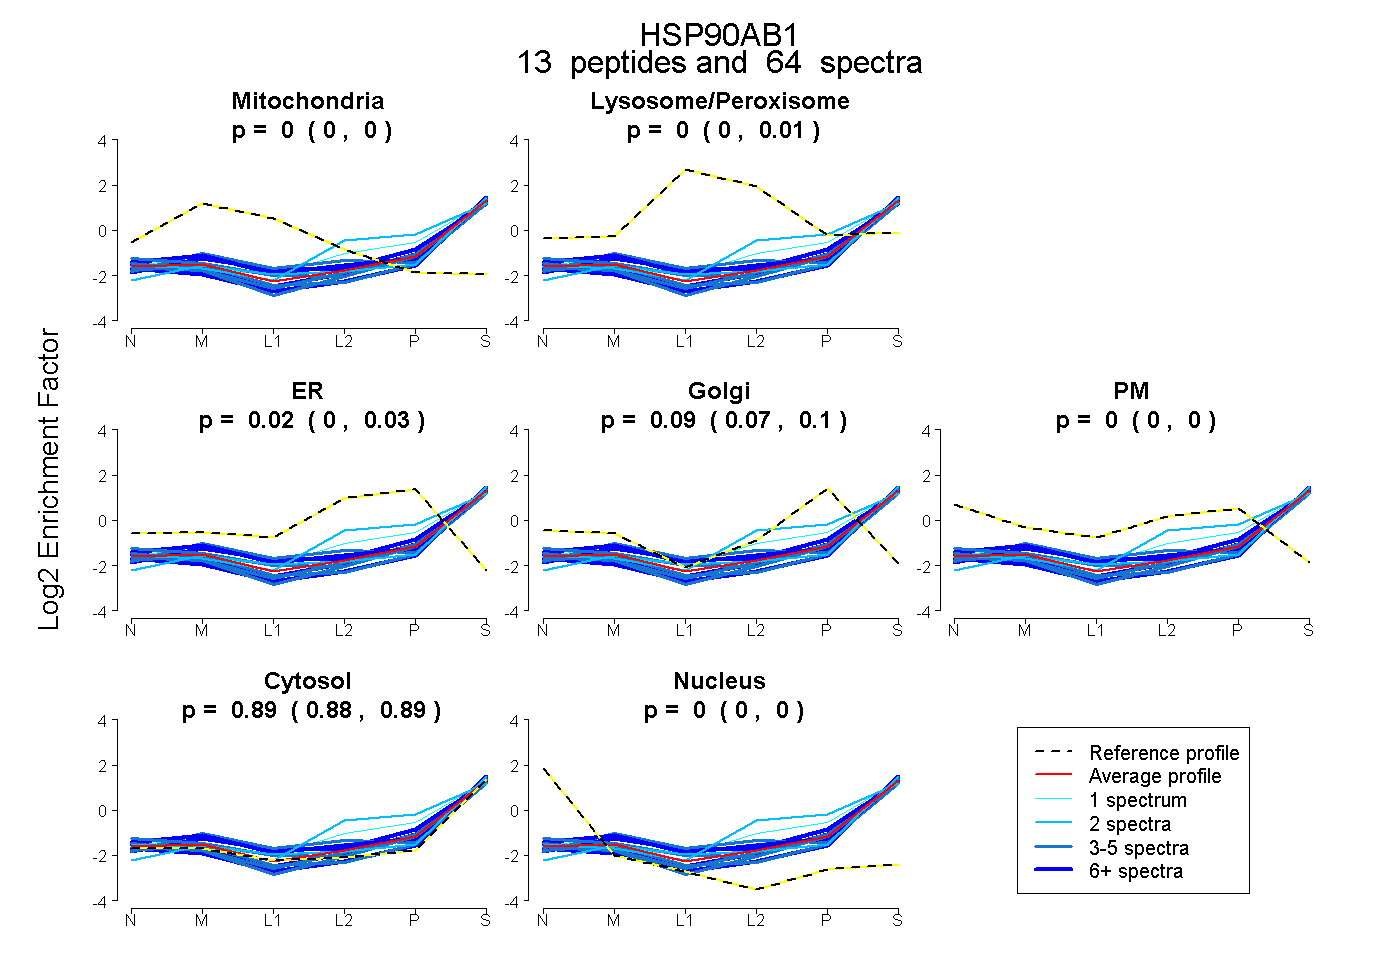
0.000 | 0.000
0.000 | 0.012
0.000 | 0.032
0.071 | 0.104
0.000 | 0.000
0.884 | 0.895
0.000 | 0.000
28peptides
spectra
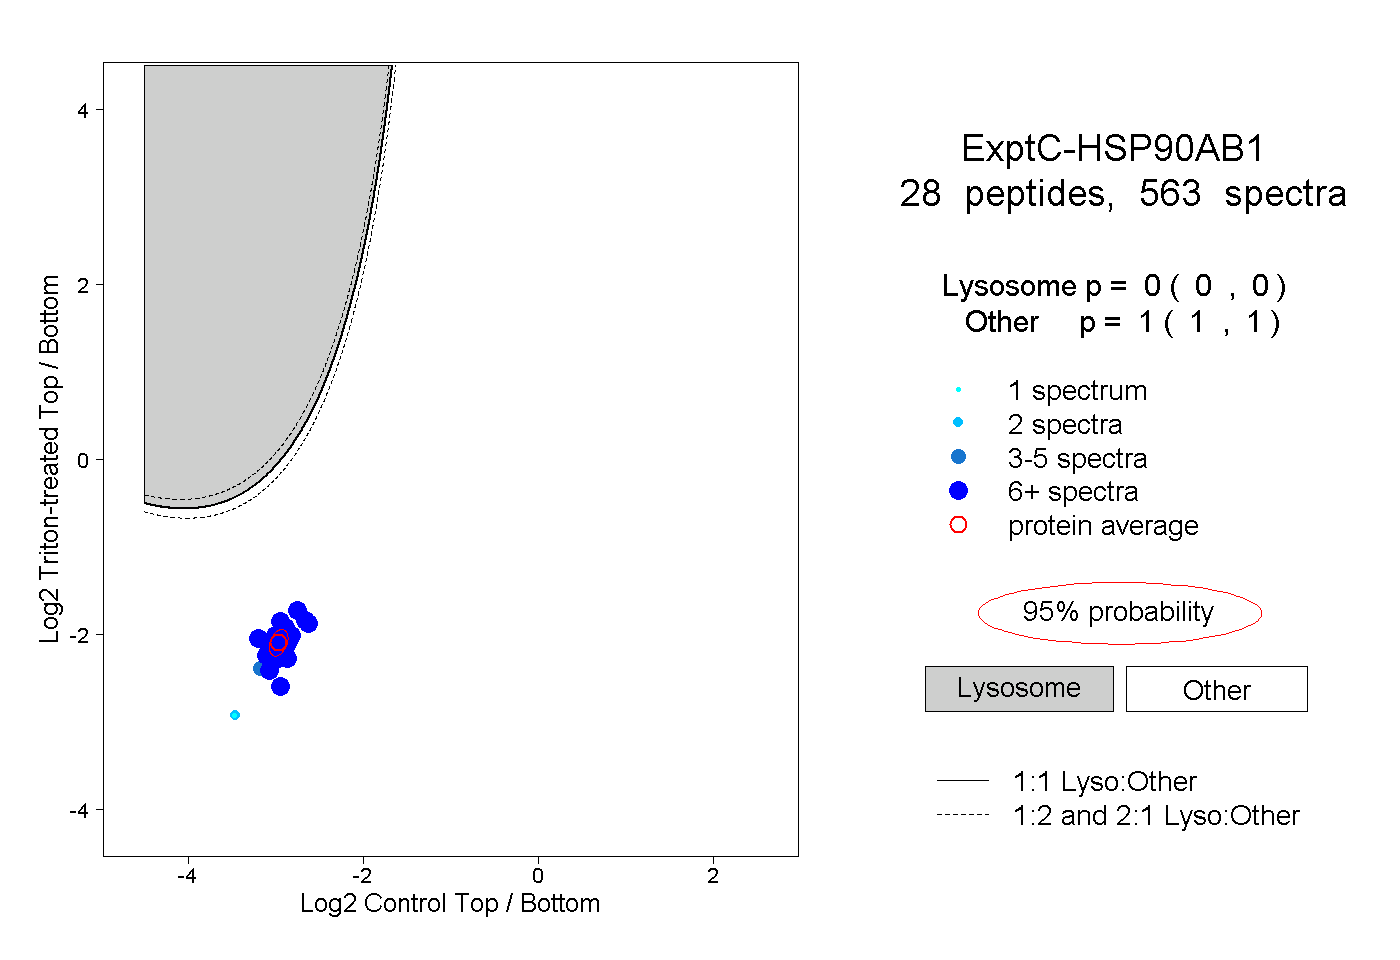
0.000 | 0.000
1.000 | 1.000
9peptides
spectra
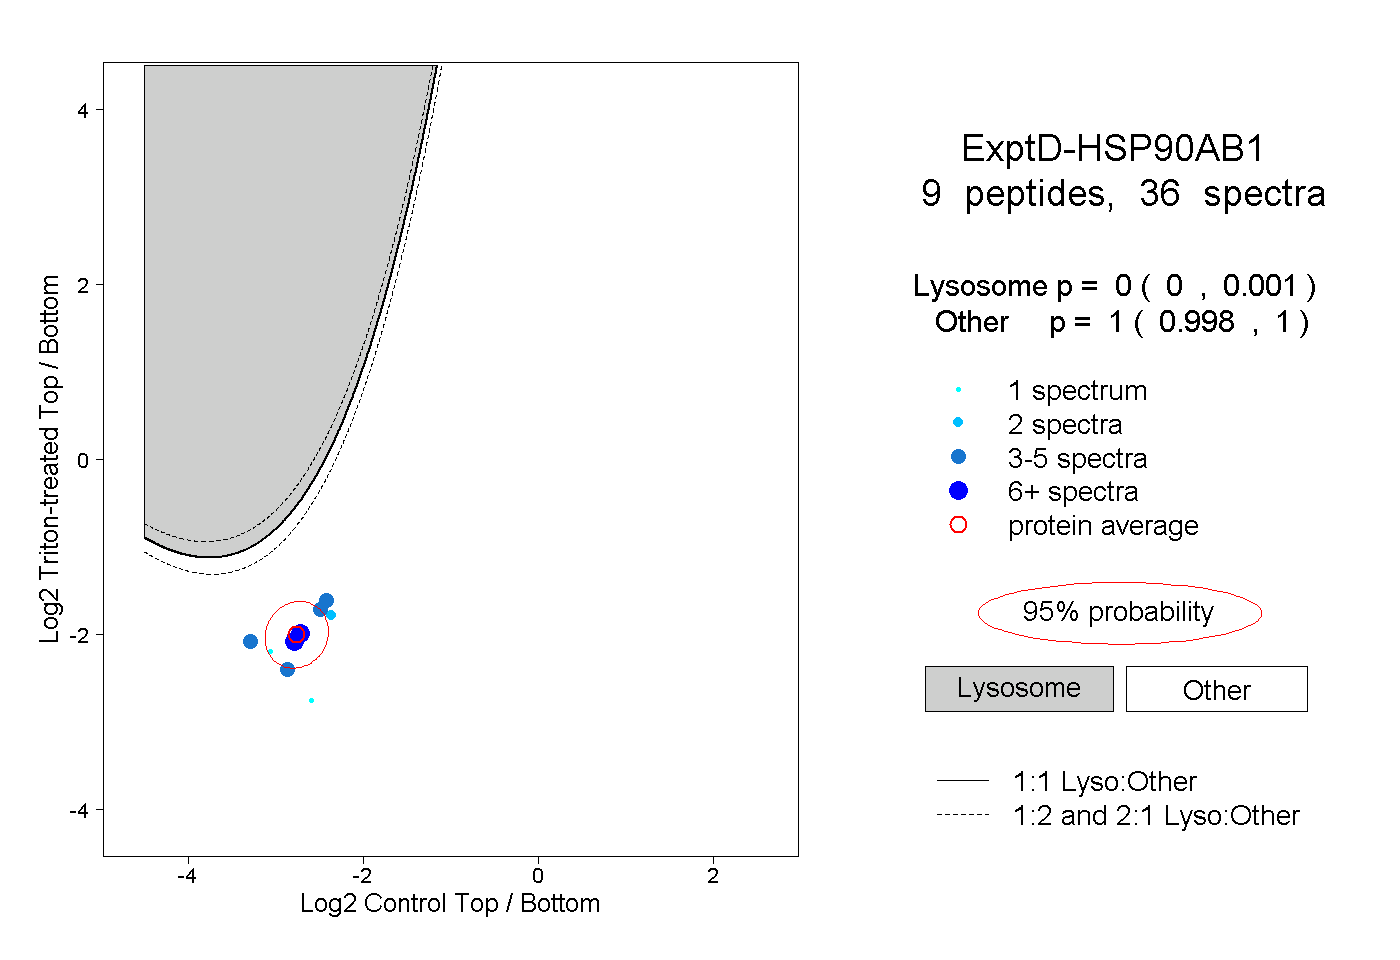
0.000 | 0.001
0.998 | 1.000