 3
3peptides
spectra
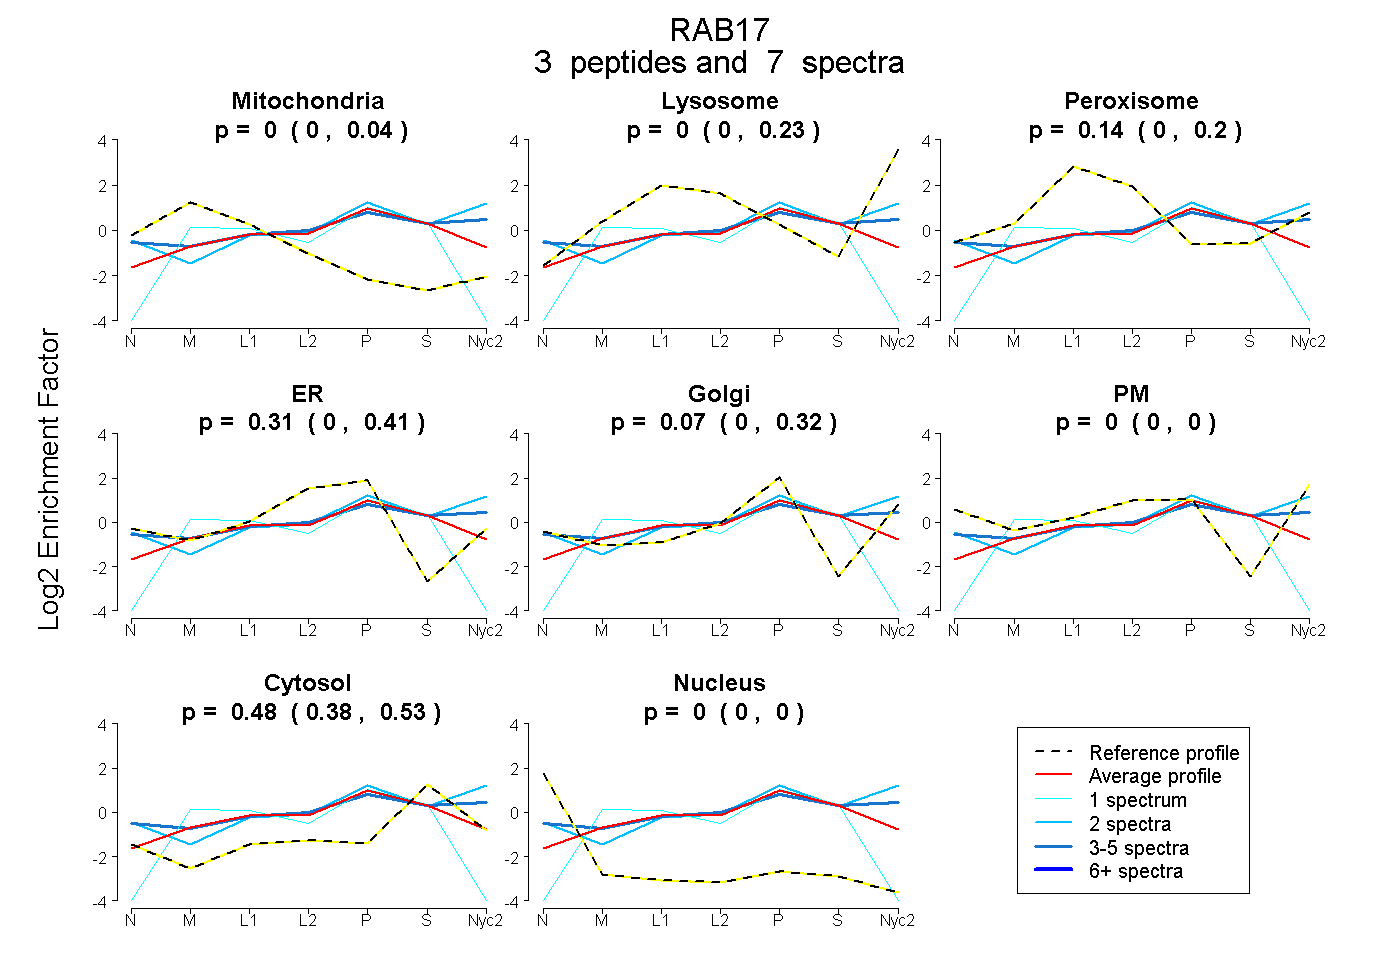
0.000 | 0.045
0.000 | 0.226
0.000 | 0.205
0.000 | 0.410
0.000 | 0.318
0.000 | 0.000
0.384 | 0.529
0.000 | 0.000
5peptides
spectra
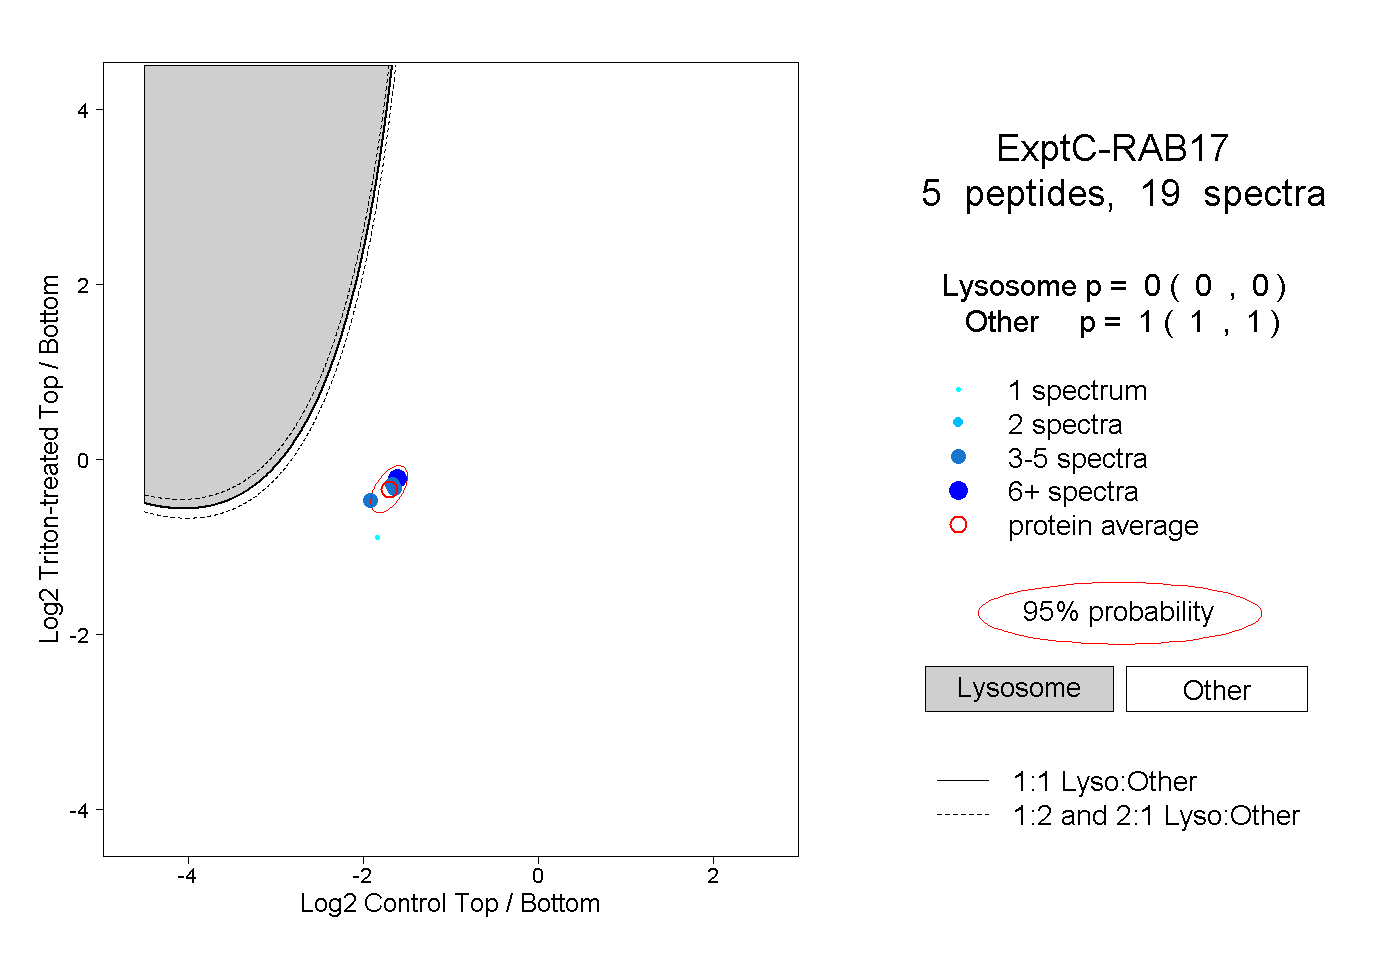
0.000 | 0.000
1.000 | 1.000
1peptide
spectrum
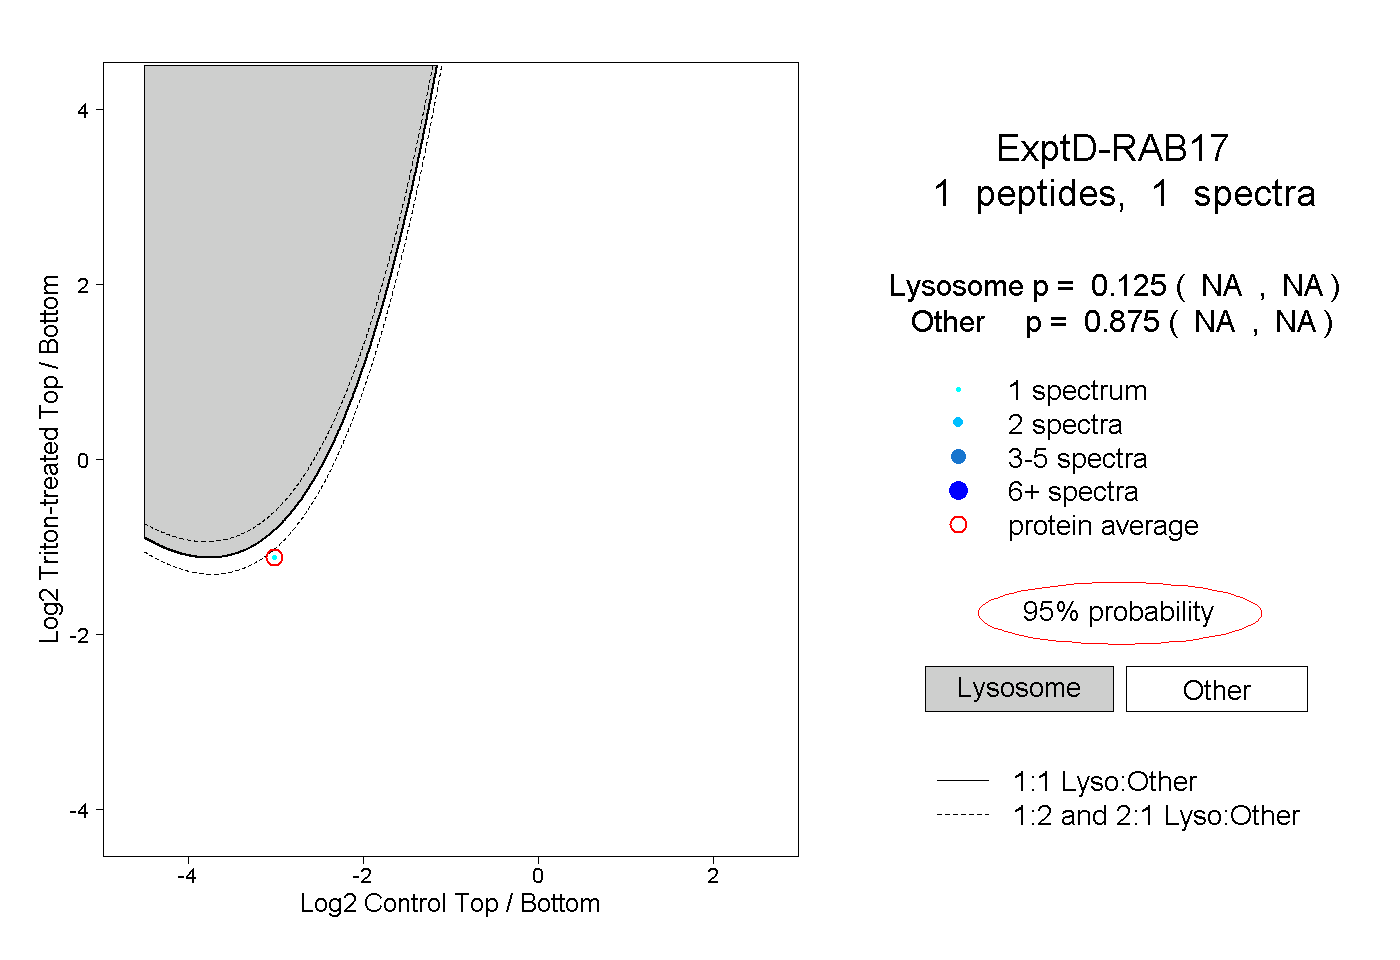
NA | NA
NA | NA