 4
4peptides
spectra
0.000 | 0.063
0.000 | 0.018
0.000 | 0.018
0.000 | 0.000
0.000 | 0.000
0.000 | 0.000
0.899 | 0.987
0.000 | 0.071
2peptides
spectra
NA | NA
NA | NA
NA | NA
NA | NA
NA | NA
NA | NA
NA | NA
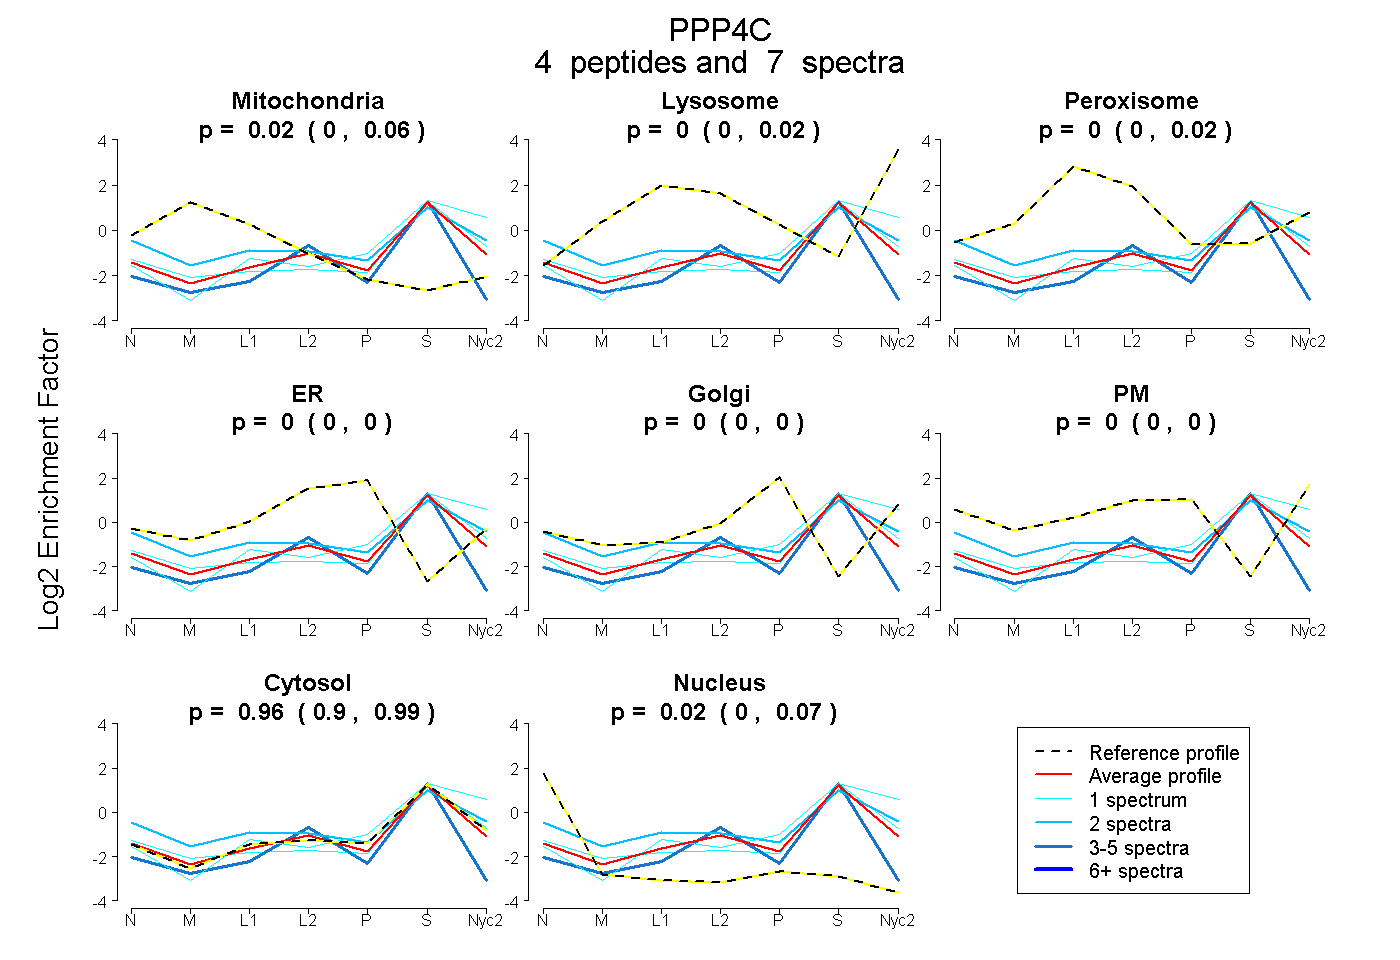
| Plot | Mito | Lyso | Perox | ER | Golgi | PM | Cytosol | Nucleus | |||||
| Expt A |
4 peptides |
7 spectra |
|
0.022 0.000 | 0.063 |
0.000 0.000 | 0.018 |
0.000 0.000 | 0.018 |
0.000 0.000 | 0.000 |
0.000 0.000 | 0.000 |
0.000 0.000 | 0.000 |
0.958 0.899 | 0.987 |
0.020 0.000 | 0.071 |
||
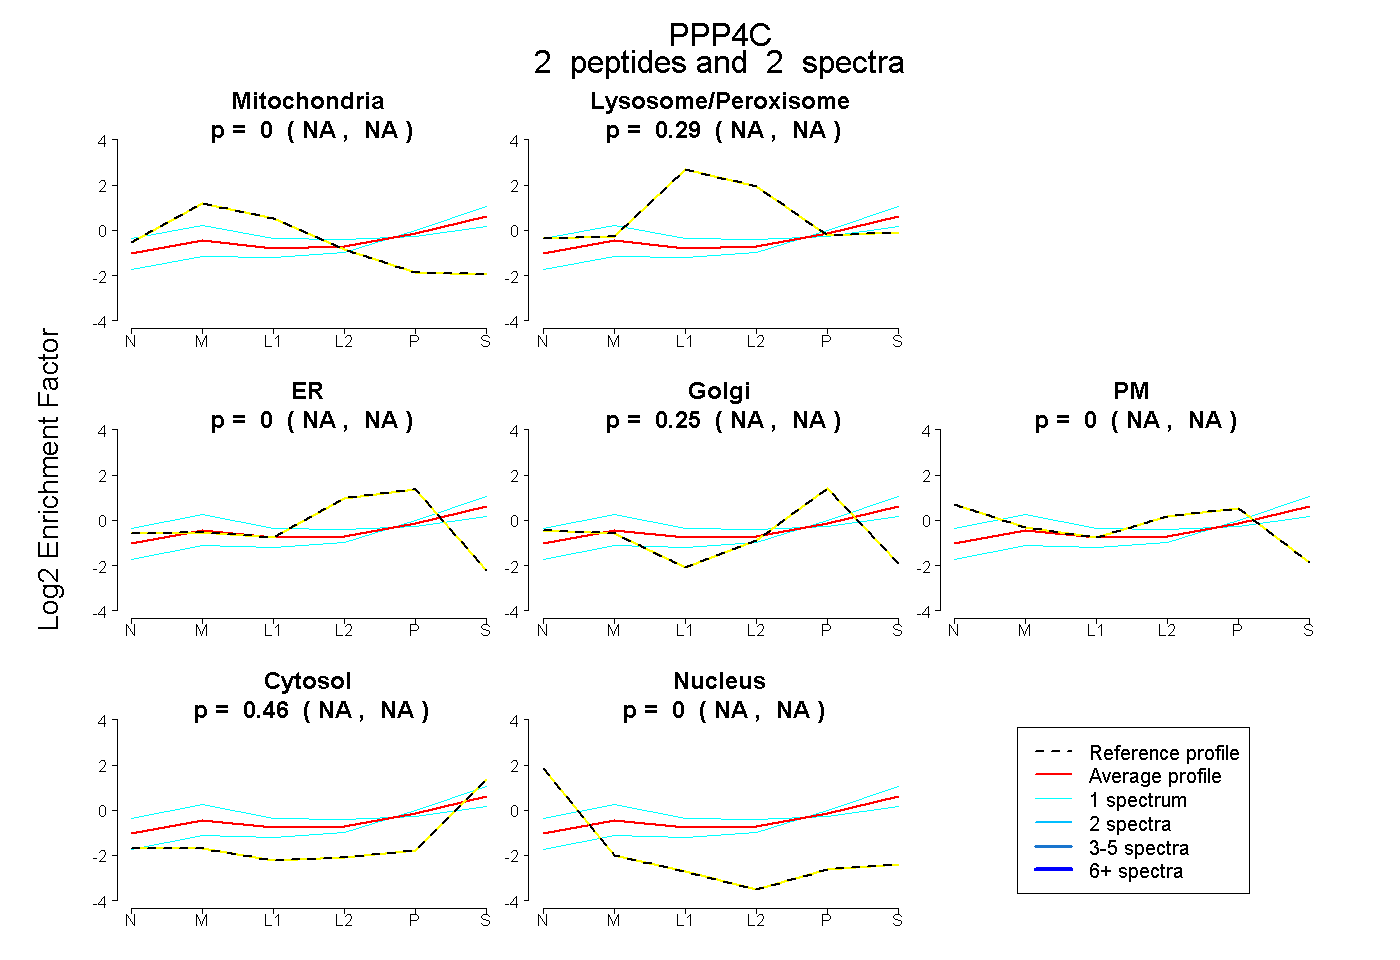
| Plot | Mito | Lyso or Perox | ER | Golgi | PM | Cytosol | Nucleus | ||||||
| Expt B |
2 peptides |
2 spectra |
|
0.000 NA | NA |
0.292 NA | NA |
0.000 NA | NA |
0.251 NA | NA |
0.000 NA | NA |
0.457 NA | NA |
0.000 NA | NA |
| 1 spectrum, DFIIFEAAPQETR | 0.144 | 0.270 | 0.000 | 0.138 | 0.152 | 0.297 | 0.000 | |||
| 1 spectrum, EILVEESNVQR | 0.000 | 0.201 | 0.000 | 0.197 | 0.000 | 0.602 | 0.000 |