 4
4peptides
spectra
0.000 | 0.063
0.000 | 0.018
0.000 | 0.018
0.000 | 0.000
0.000 | 0.000
0.000 | 0.000
0.899 | 0.987
0.000 | 0.071
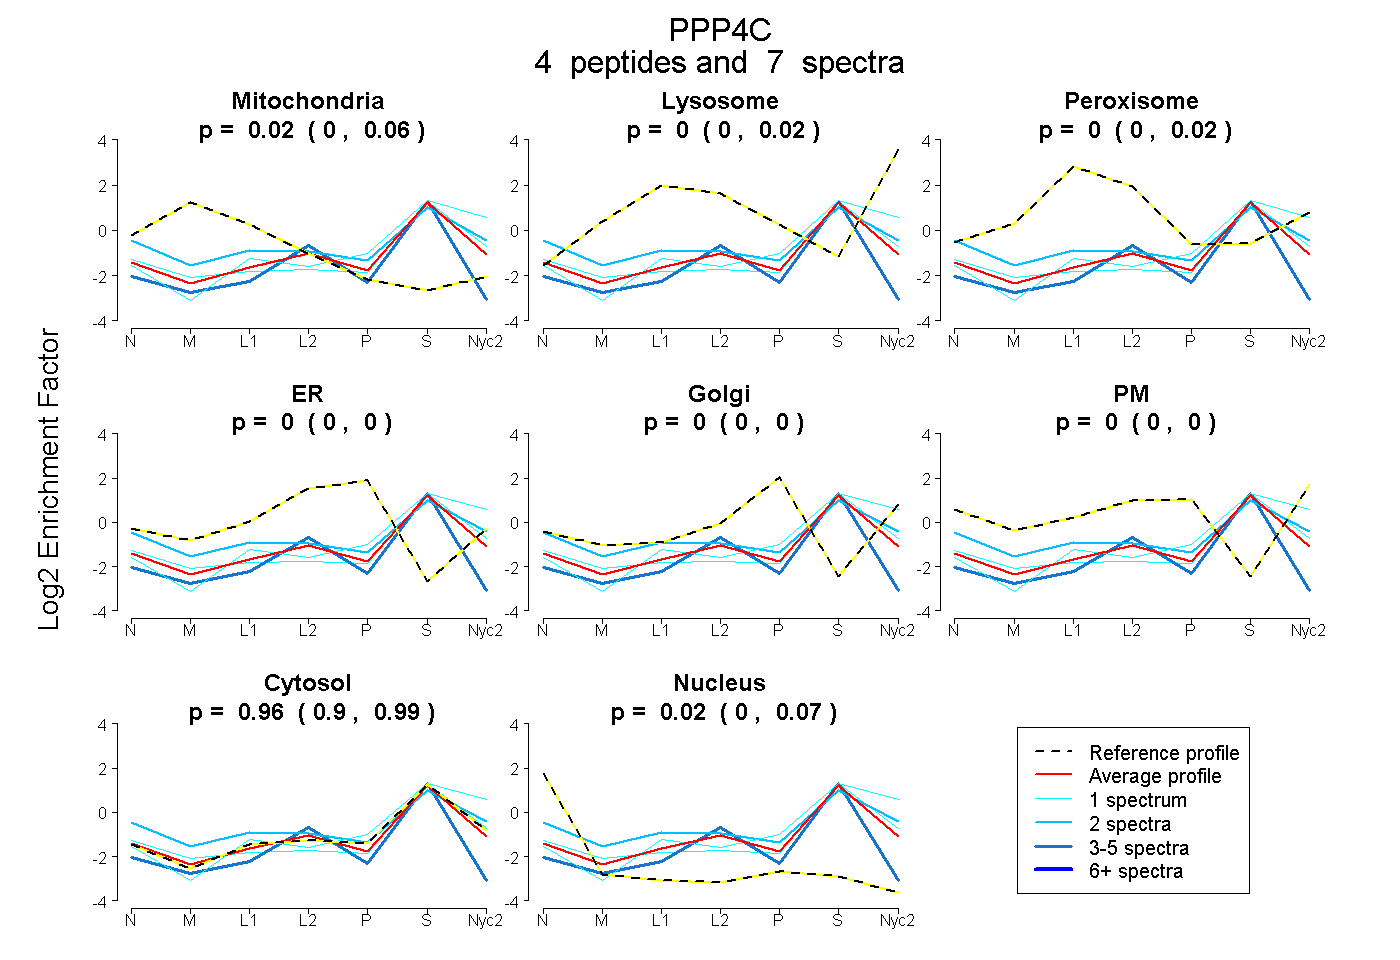
| Plot | Mito | Lyso | Perox | ER | Golgi | PM | Cytosol | Nucleus | |||||
| Expt A |
4 peptides |
7 spectra |
|
0.022 0.000 | 0.063 |
0.000 0.000 | 0.018 |
0.000 0.000 | 0.018 |
0.000 0.000 | 0.000 |
0.000 0.000 | 0.000 |
0.000 0.000 | 0.000 |
0.958 0.899 | 0.987 |
0.020 0.000 | 0.071 |
| 3 spectra, EILVEESNVQR | 0.000 | 0.000 | 0.000 | 0.000 | 0.000 | 0.000 | 0.870 | 0.130 | ||
| 1 spectrum, YGSVTVWR | 0.000 | 0.085 | 0.000 | 0.000 | 0.000 | 0.000 | 0.915 | 0.000 | ||
| 1 spectrum, CGNVAAILELDEHLQK | 0.014 | 0.000 | 0.000 | 0.000 | 0.000 | 0.000 | 0.946 | 0.040 | ||
| 2 spectra, KPVADYFL | 0.032 | 0.000 | 0.136 | 0.000 | 0.000 | 0.050 | 0.746 | 0.036 |
| Plot | Mito | Lyso or Perox | ER | Golgi | PM | Cytosol | Nucleus | ||||||
| Expt B |
2 peptides |
2 spectra |
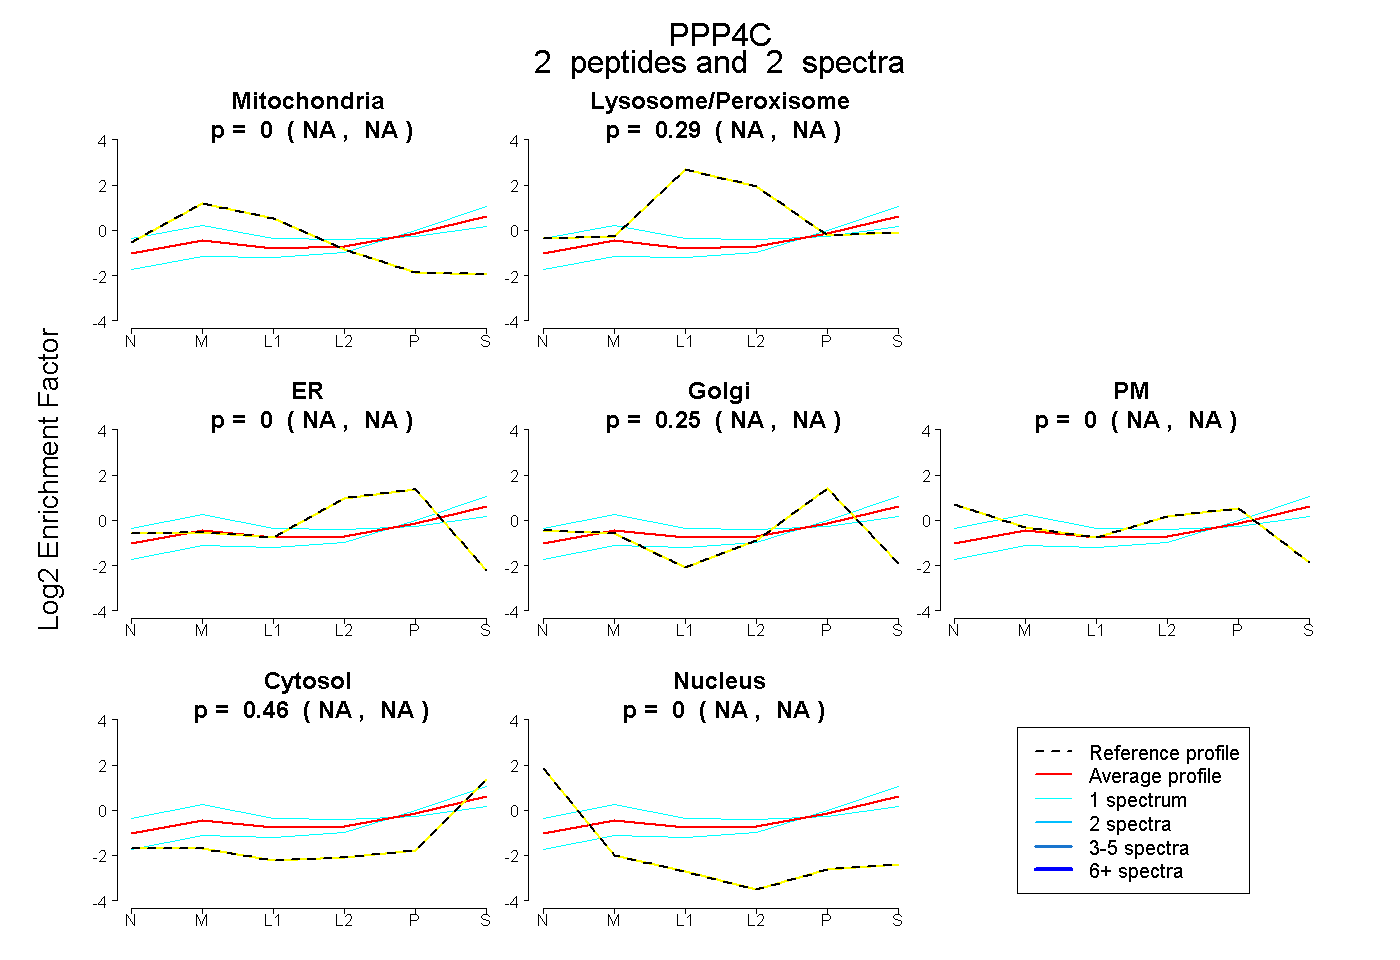 |
0.000 NA | NA |
0.292 NA | NA |
0.000 NA | NA |
0.251 NA | NA |
0.000 NA | NA |
0.457 NA | NA |
0.000 NA | NA |