 1
1peptide
spectrum
NA | NA
NA | NA
NA | NA
NA | NA
NA | NA
NA | NA
NA | NA
NA | NA
| Plot | Mito | Lyso | Perox | ER | Golgi | PM | Cytosol | Nucleus | |||||
| Expt A |
1 peptide |
1 spectrum |
|
0.000 NA | NA |
0.305 NA | NA |
0.000 NA | NA |
0.000 NA | NA |
0.168 NA | NA |
0.268 NA | NA |
0.259 NA | NA |
0.000 NA | NA |
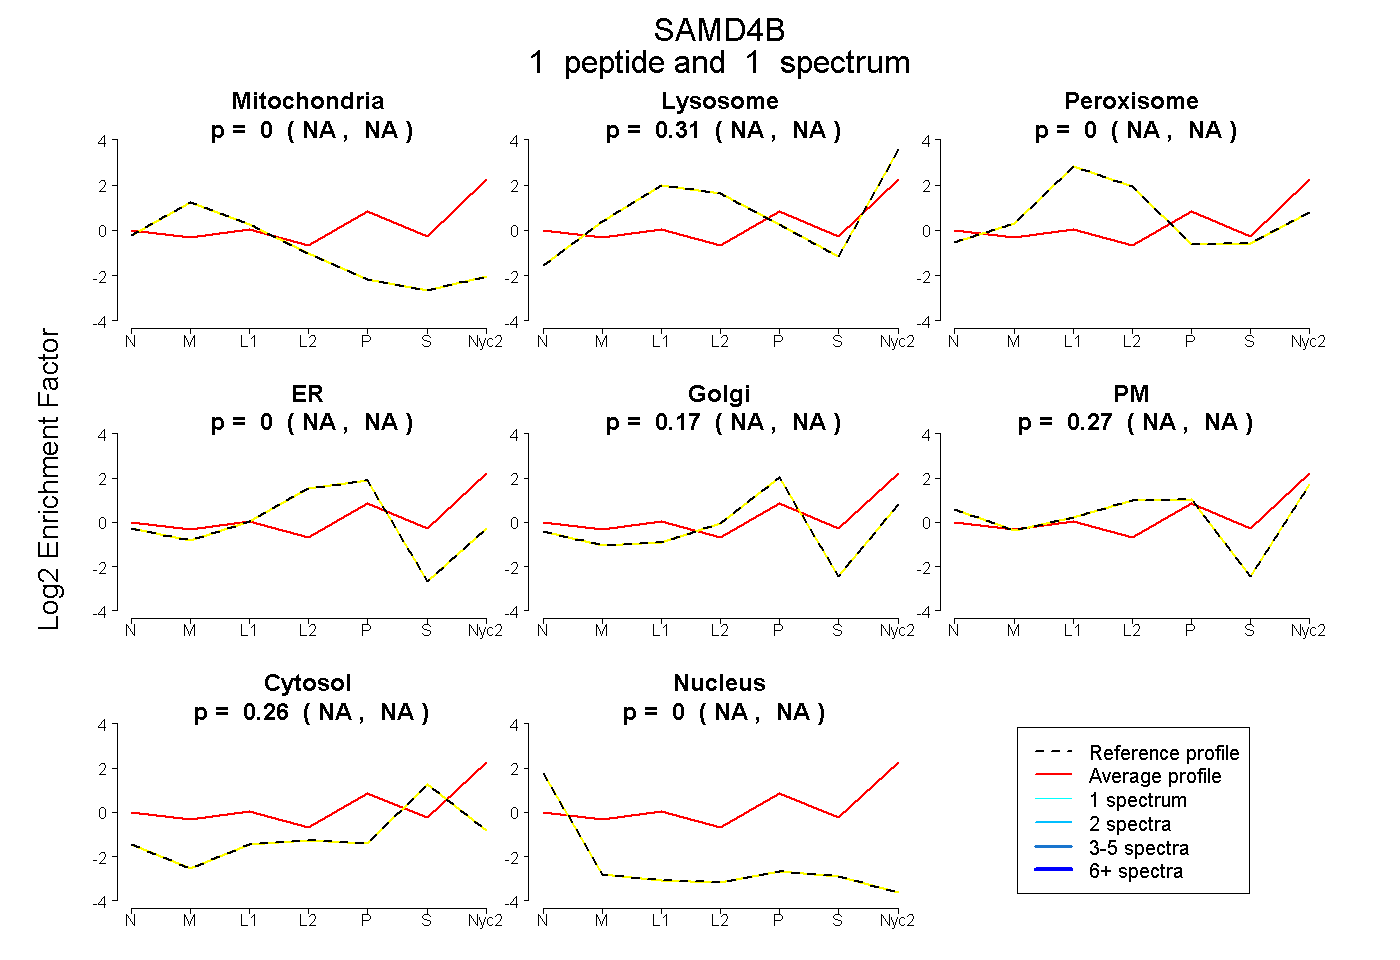
| 1 spectrum, DQVGILASWFK | 0.000 | 0.305 | 0.000 | 0.000 | 0.168 | 0.268 | 0.259 | 0.000 |
| Plot | Lyso | Other | |||||||||||
| Expt D |
1 peptide |
1 spectrum |
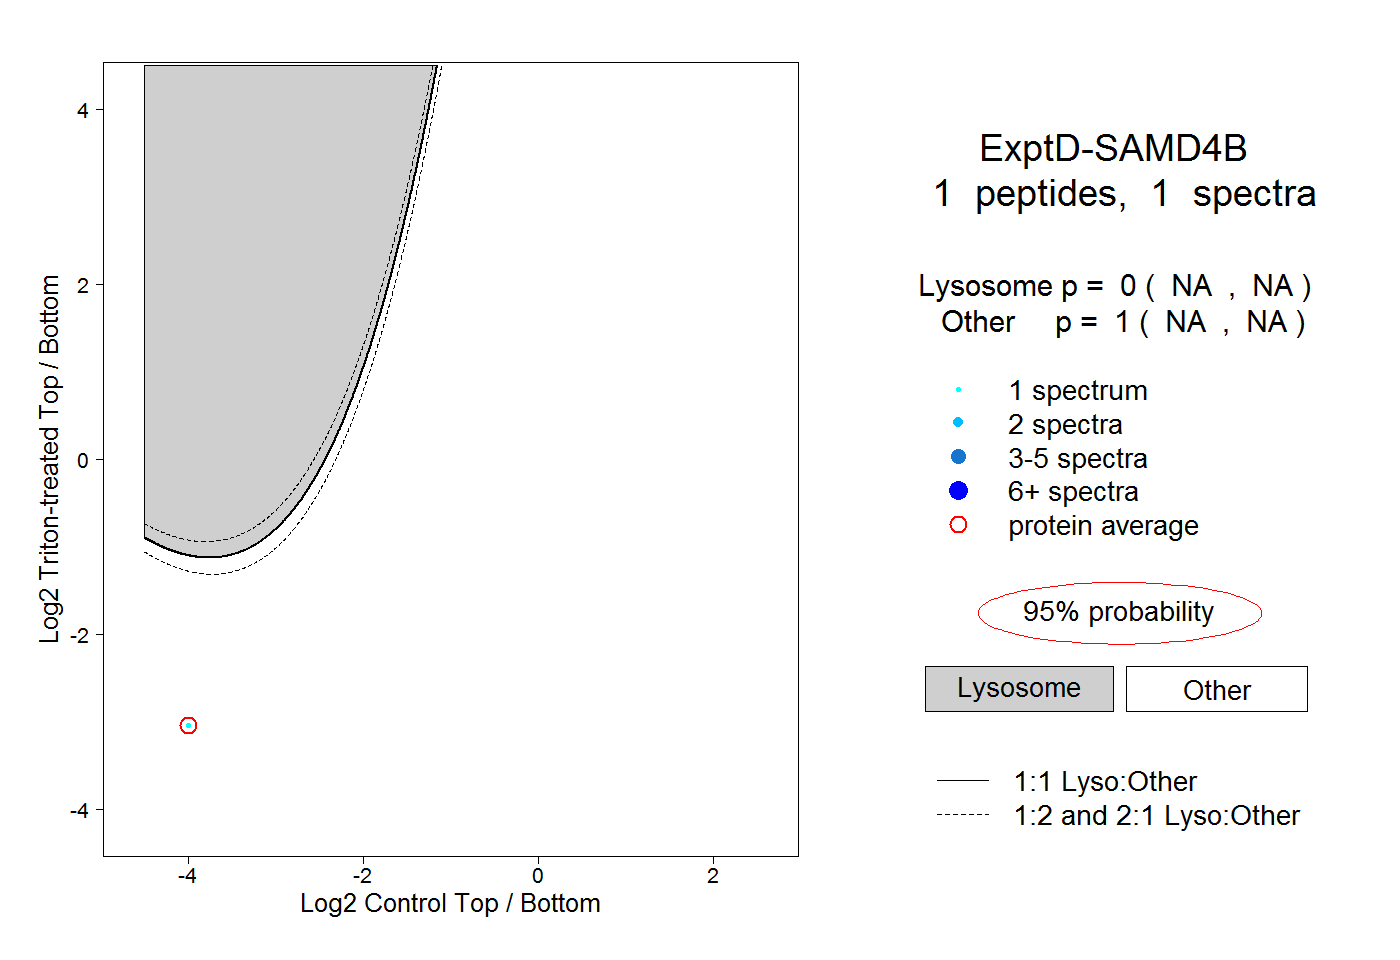 |
0.000 NA | NA |
1.000 NA | NA |