 3
3peptides
spectra
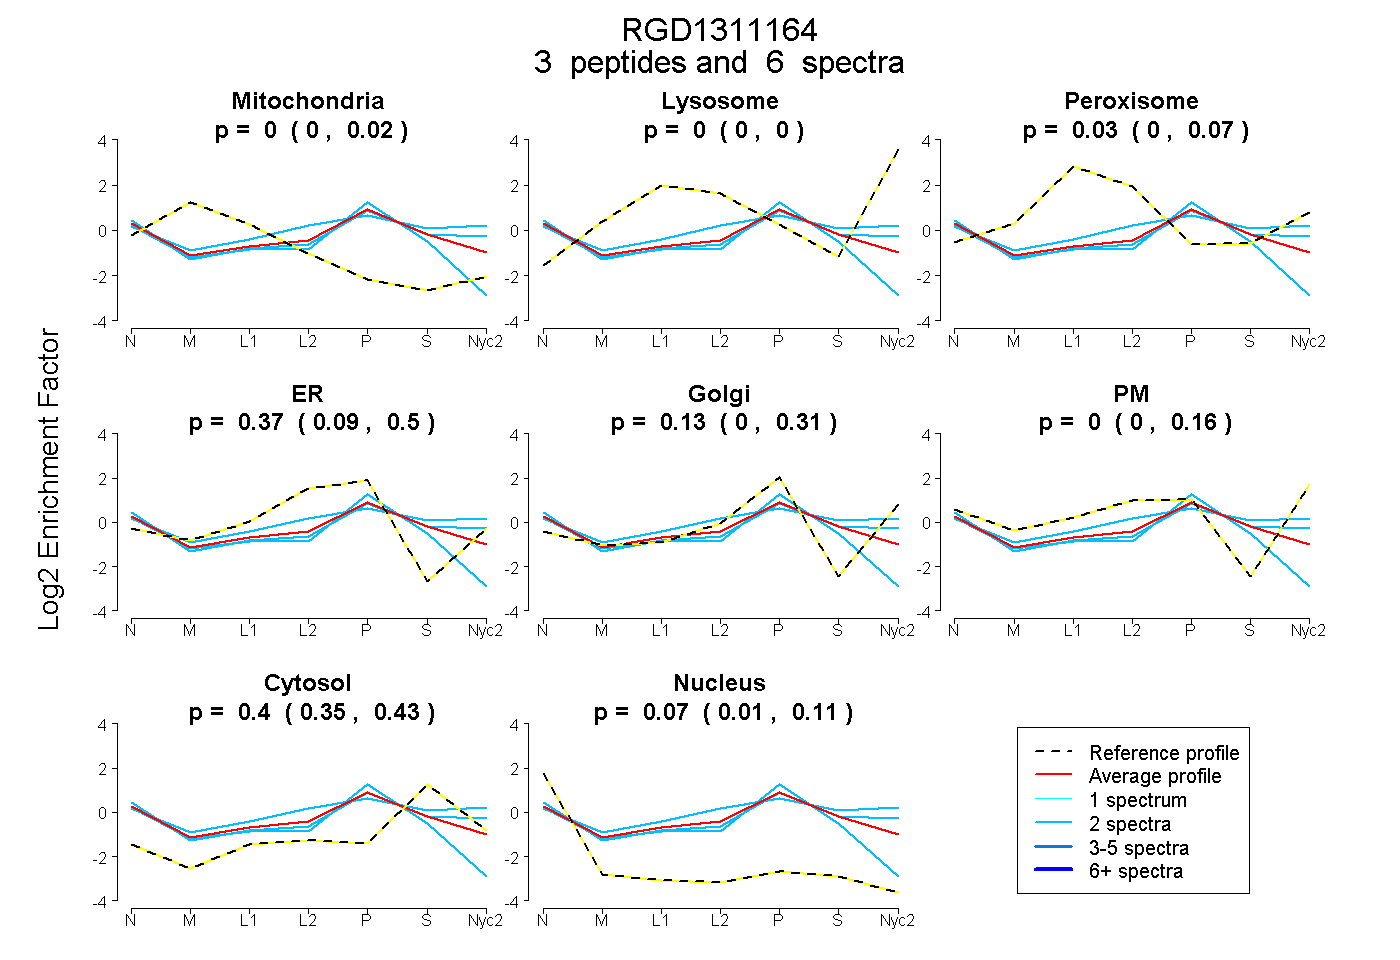
0.000 | 0.019
0.000 | 0.000
0.000 | 0.072
0.090 | 0.503
0.000 | 0.313
0.000 | 0.162
0.355 | 0.430
0.015 | 0.109
5peptides
spectra
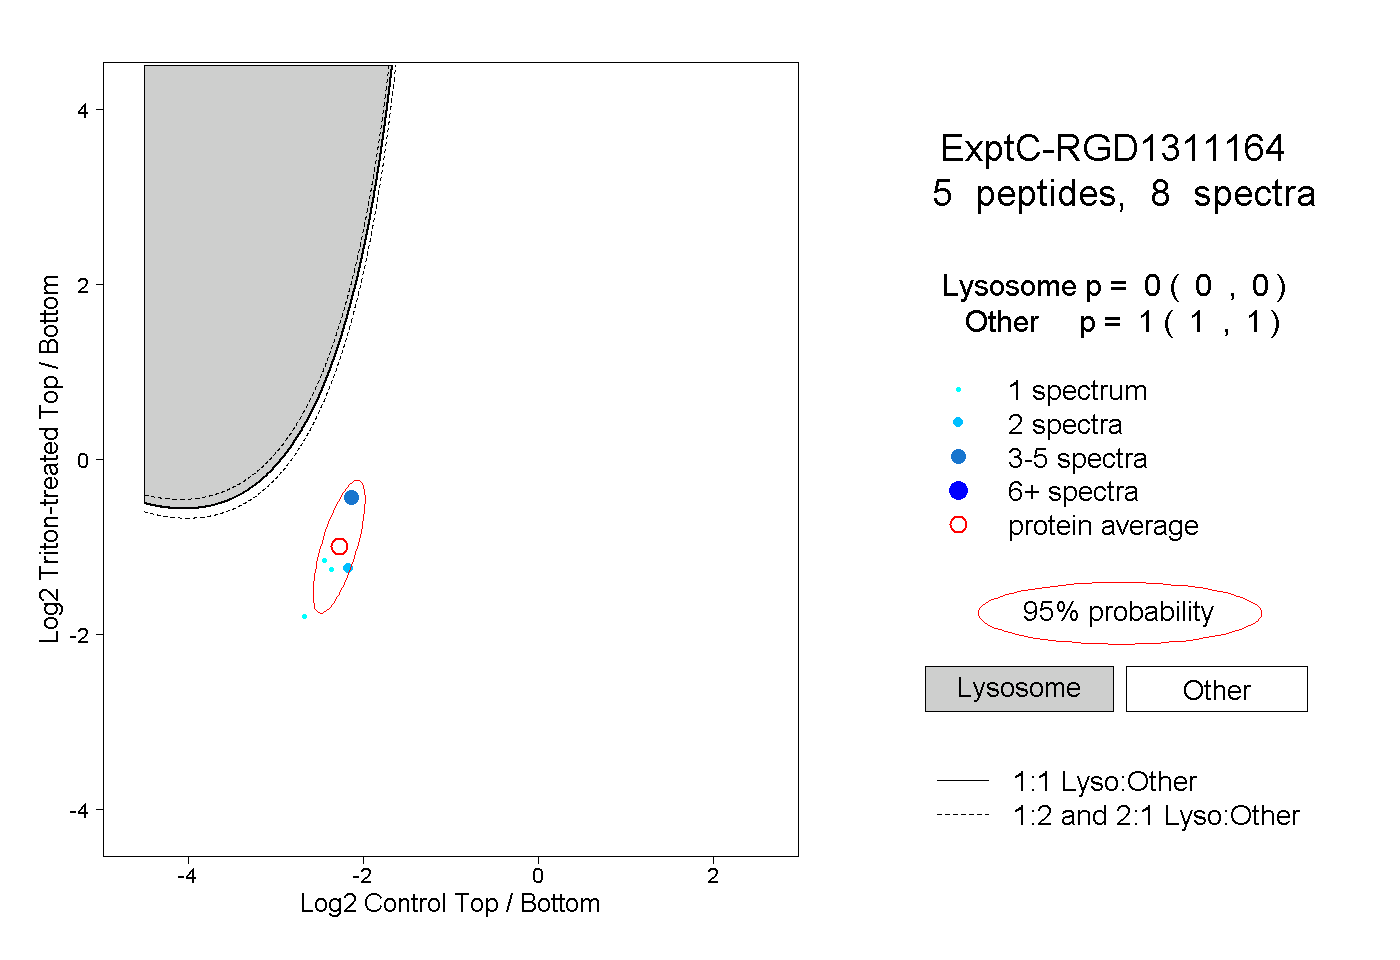
0.000 | 0.000
1.000 | 1.000
| Plot | Mito | Lyso | Perox | ER | Golgi | PM | Cytosol | Nucleus | |||||
| Expt A |
3 peptides |
6 spectra |
|
0.000 0.000 | 0.019 |
0.000 0.000 | 0.000 |
0.032 0.000 | 0.072 |
0.365 0.090 | 0.503 |
0.134 0.000 | 0.313 |
0.000 0.000 | 0.162 |
0.396 0.355 | 0.430 |
0.073 0.015 | 0.109 |
||
| Plot | Lyso | Other | |||||||||||
| Expt C |
5 peptides |
8 spectra |
|
0.000 0.000 | 0.000 |
1.000 1.000 | 1.000 |