4
4peptides
spectra
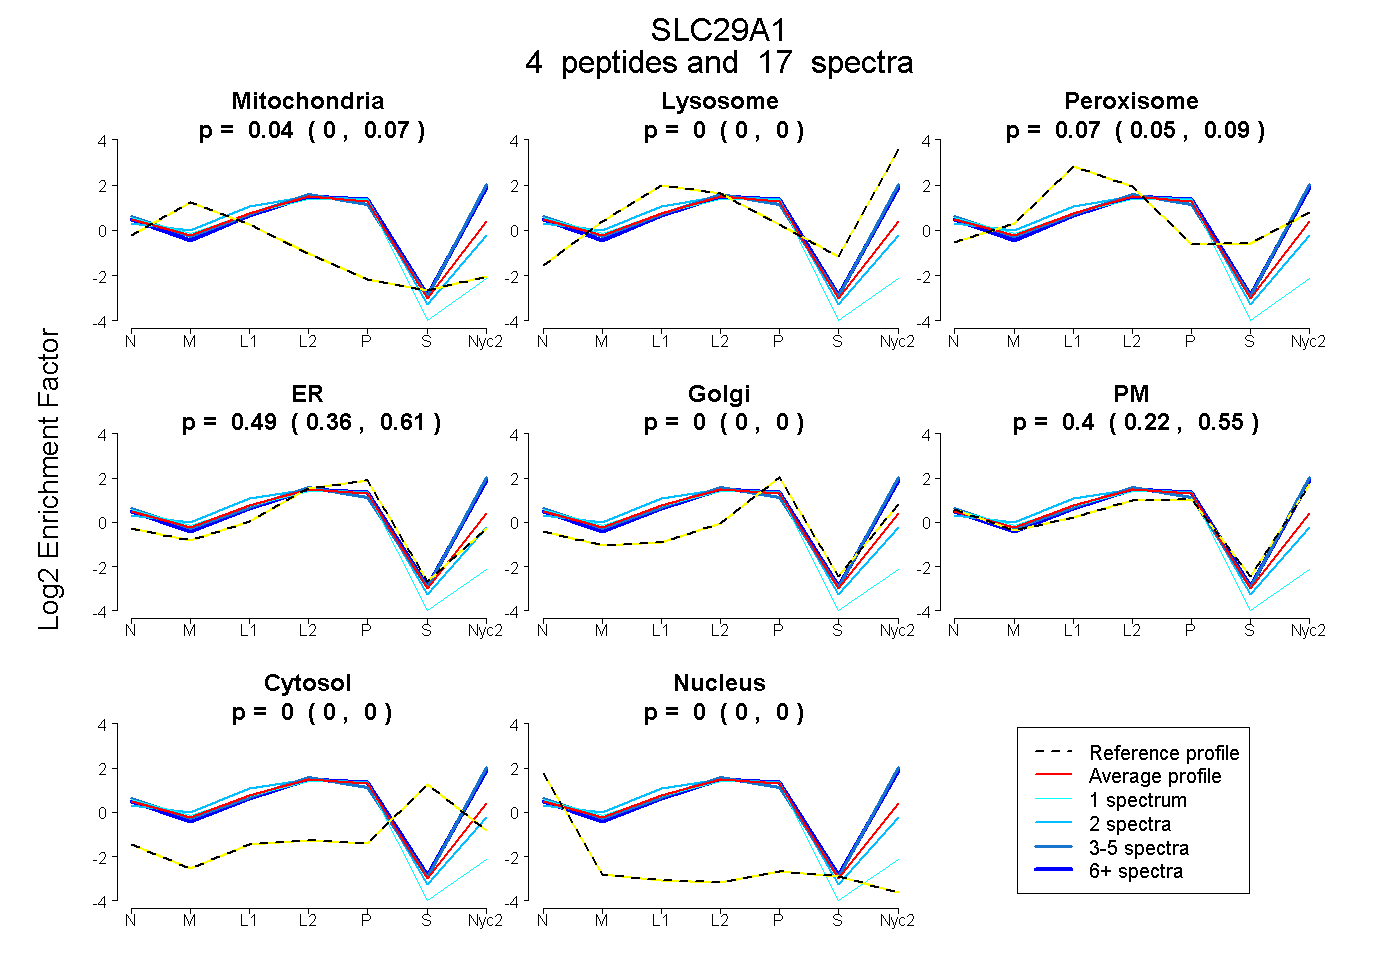
0.000 | 0.074
0.000 | 0.000
0.051 | 0.089
0.360 | 0.607
0.000 | 0.000
0.217 | 0.548
0.000 | 0.000
0.000 | 0.000
2peptides
spectra
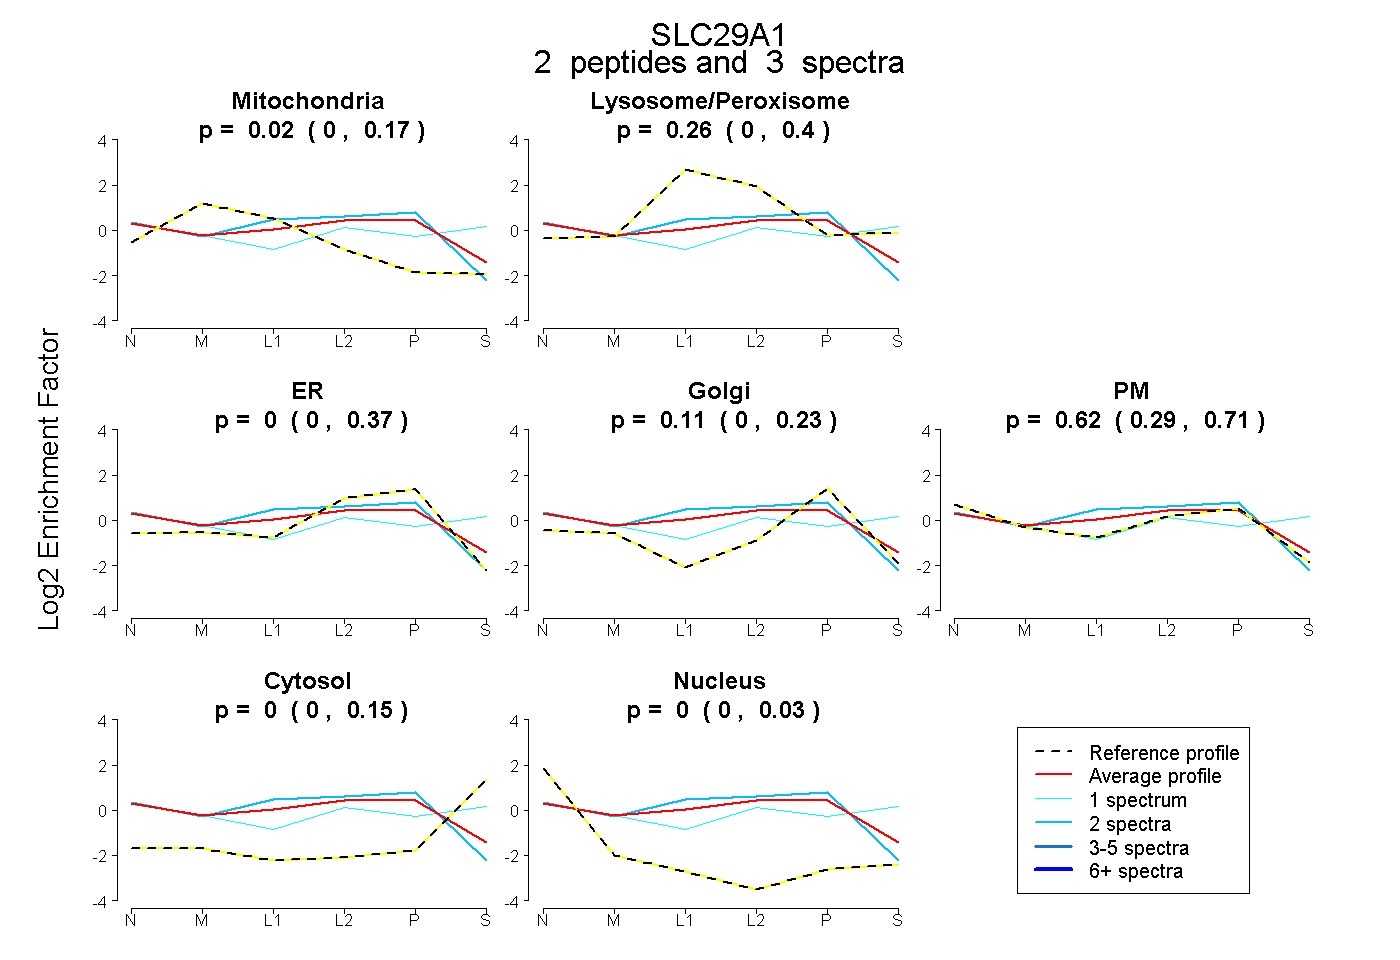
0.000 | 0.167
0.000 | 0.398
0.000 | 0.372
0.000 | 0.228
0.288 | 0.709
0.000 | 0.147
0.000 | 0.027