 3
3peptides
spectra
0.000 | 0.121
0.000 | 0.000
0.000 | 0.140
0.034 | 0.175
0.000 | 0.000
0.000 | 0.000
0.577 | 0.690
0.077 | 0.203
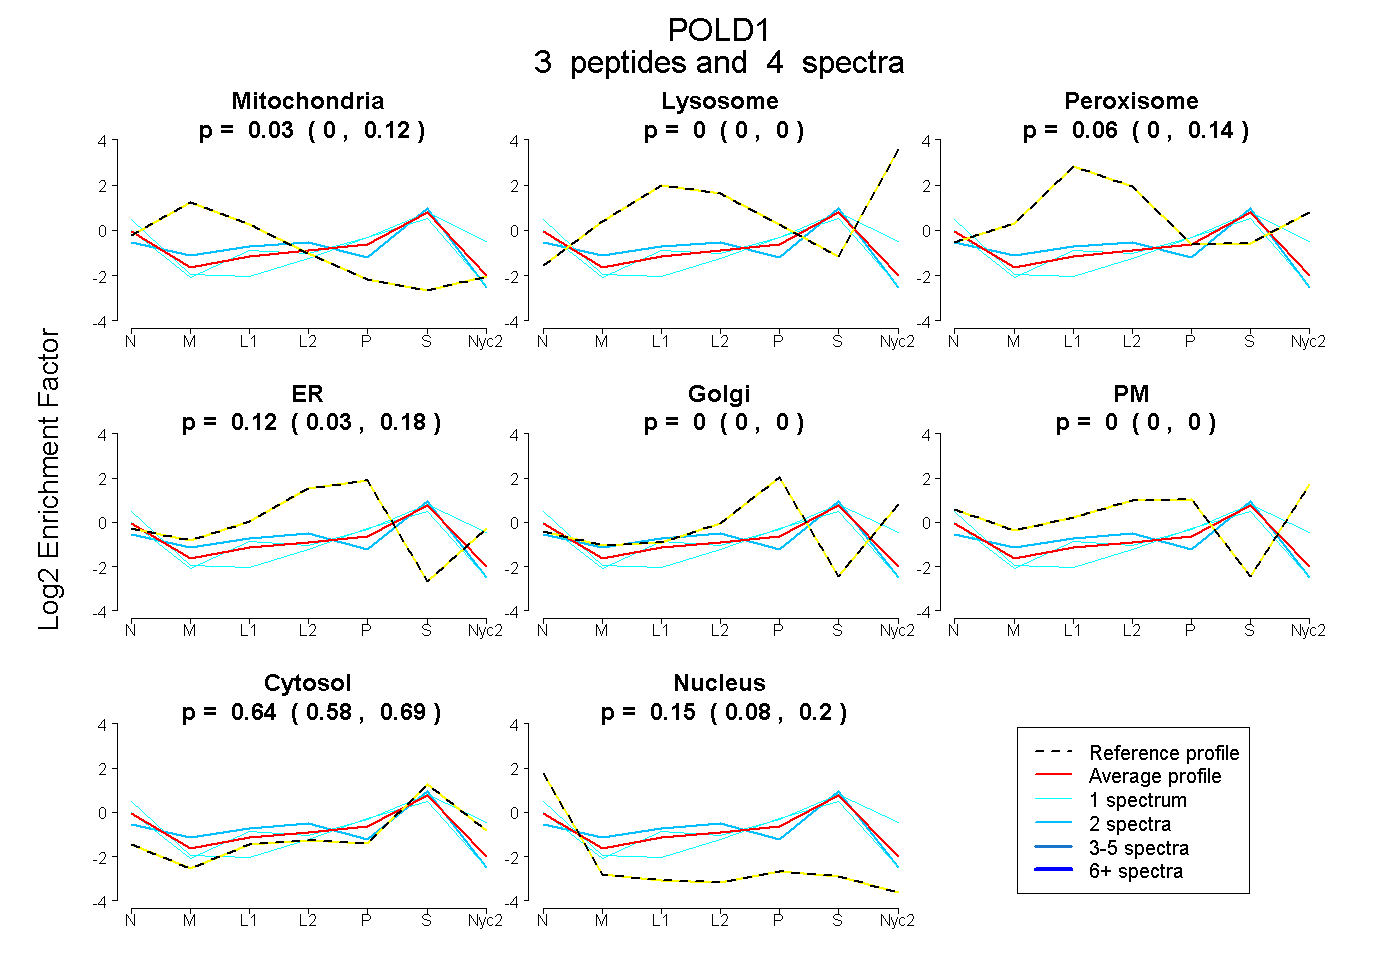
| Plot | Mito | Lyso | Perox | ER | Golgi | PM | Cytosol | Nucleus | |||||
| Expt A |
3 peptides |
4 spectra |
|
0.034 0.000 | 0.121 |
0.000 0.000 | 0.000 |
0.060 0.000 | 0.140 |
0.117 0.034 | 0.175 |
0.000 0.000 | 0.000 |
0.000 0.000 | 0.000 |
0.640 0.577 | 0.690 |
0.149 0.077 | 0.203 |
| 1 spectrum, EVSHLNALEER | 0.000 | 0.000 | 0.000 | 0.000 | 0.000 | 0.245 | 0.720 | 0.035 | ||
| 2 spectra, CQGSLHEDVICTSR | 0.263 | 0.000 | 0.044 | 0.000 | 0.000 | 0.000 | 0.676 | 0.016 | ||
| 1 spectrum, VTGVPLGYLLSR | 0.000 | 0.000 | 0.000 | 0.155 | 0.000 | 0.000 | 0.561 | 0.284 |