 13
13peptides
spectra
0.000 | 0.000
0.000 | 0.000
0.000 | 0.000
0.000 | 0.000
0.063 | 0.085
0.084 | 0.107
0.824 | 0.832
0.000 | 0.000
| Plot | Mito | Lyso | Perox | ER | Golgi | PM | Cytosol | Nucleus | |||||
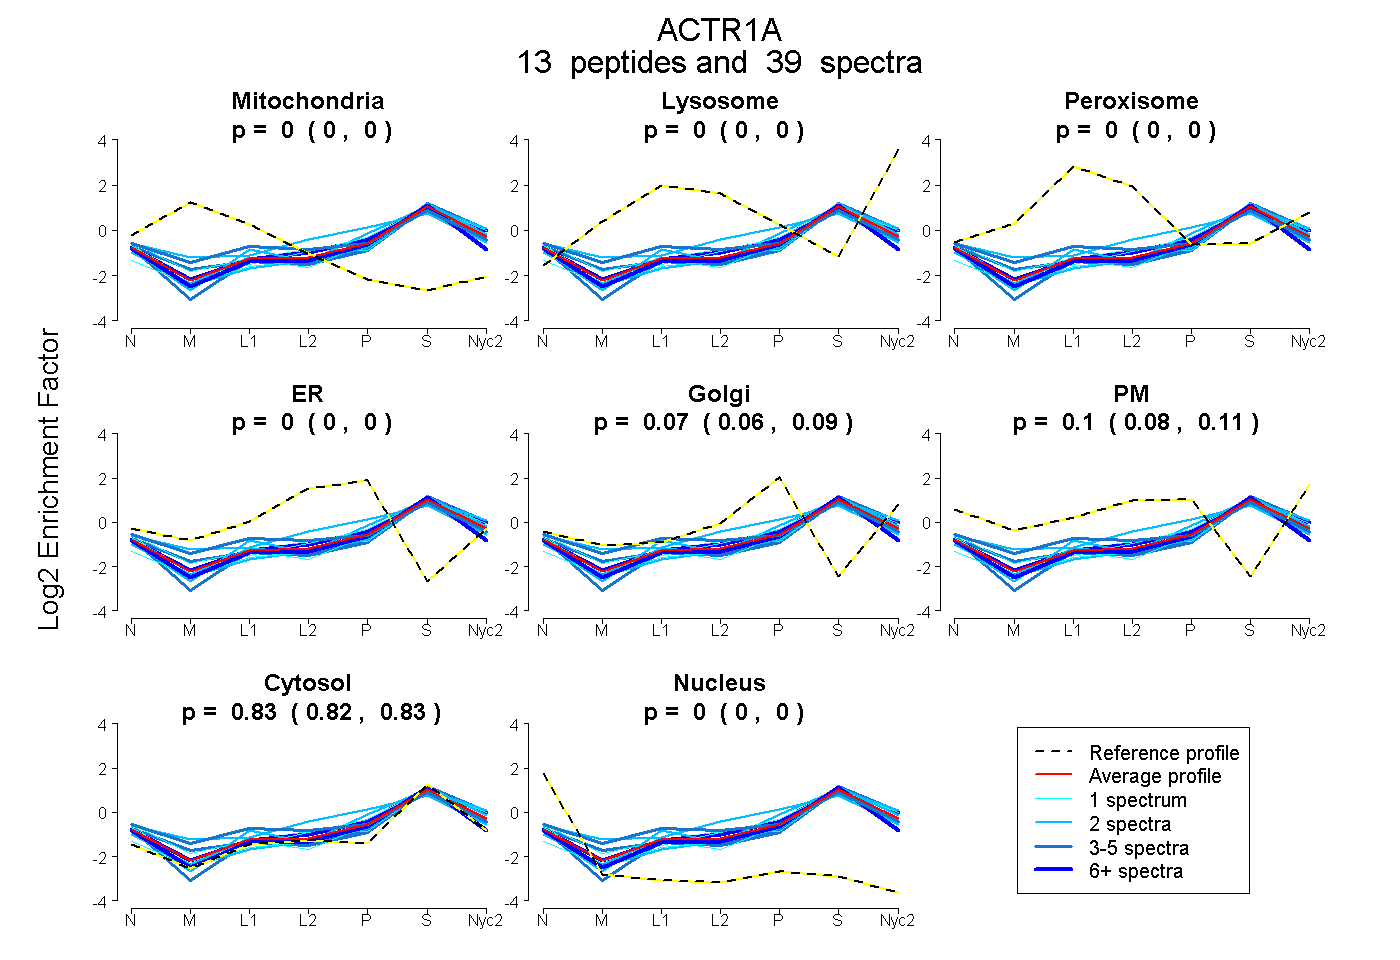
| Expt A |
13 peptides |
39 spectra |
|
0.000 0.000 | 0.000 |
0.000 0.000 | 0.000 |
0.000 0.000 | 0.000 |
0.000 0.000 | 0.000 |
0.075 0.063 | 0.085 |
0.097 0.084 | 0.107 |
0.828 0.824 | 0.832 |
0.000 0.000 | 0.000 |
| 1 spectrum, DQLQTFSEEHPVLLTEAPLNPR | 0.000 | 0.000 | 0.000 | 0.000 | 0.124 | 0.000 | 0.842 | 0.034 | ||
| 1 spectrum, MWVSK | 0.000 | 0.000 | 0.000 | 0.000 | 0.095 | 0.000 | 0.905 | 0.000 | ||
| 4 spectra, AQYYLPDGSTIEIGPSR | 0.000 | 0.000 | 0.000 | 0.000 | 0.035 | 0.065 | 0.900 | 0.000 | ||
| 1 spectrum, DETLETEK | 0.000 | 0.027 | 0.000 | 0.000 | 0.000 | 0.181 | 0.791 | 0.000 | ||
| 4 spectra, YPMEHGIVK | 0.021 | 0.000 | 0.103 | 0.000 | 0.012 | 0.148 | 0.717 | 0.000 | ||
| 7 spectra, YCFPNYVGRPK | 0.000 | 0.000 | 0.000 | 0.000 | 0.114 | 0.000 | 0.865 | 0.021 | ||
| 2 spectra, ISAPQER | 0.000 | 0.000 | 0.000 | 0.000 | 0.119 | 0.000 | 0.879 | 0.002 | ||
| 4 spectra, AGFAGDQIPK | 0.025 | 0.000 | 0.000 | 0.000 | 0.023 | 0.100 | 0.842 | 0.010 | ||
| 8 spectra, DWNDMER | 0.000 | 0.014 | 0.000 | 0.000 | 0.092 | 0.107 | 0.787 | 0.000 | ||
| 2 spectra, SDMDLR | 0.000 | 0.038 | 0.000 | 0.000 | 0.088 | 0.010 | 0.864 | 0.000 | ||
| 2 spectra, IWQYVYSK | 0.000 | 0.039 | 0.000 | 0.000 | 0.181 | 0.000 | 0.780 | 0.000 | ||
| 1 spectrum, LLSEVK | 0.000 | 0.000 | 0.000 | 0.000 | 0.134 | 0.086 | 0.781 | 0.000 | ||
| 2 spectra, VMAGALEGDLFIGPK | 0.000 | 0.000 | 0.072 | 0.135 | 0.152 | 0.005 | 0.636 | 0.000 |
| Plot | Mito | Lyso or Perox | ER | Golgi | PM | Cytosol | Nucleus | ||||||
| Expt B |
5 peptides |
8 spectra |
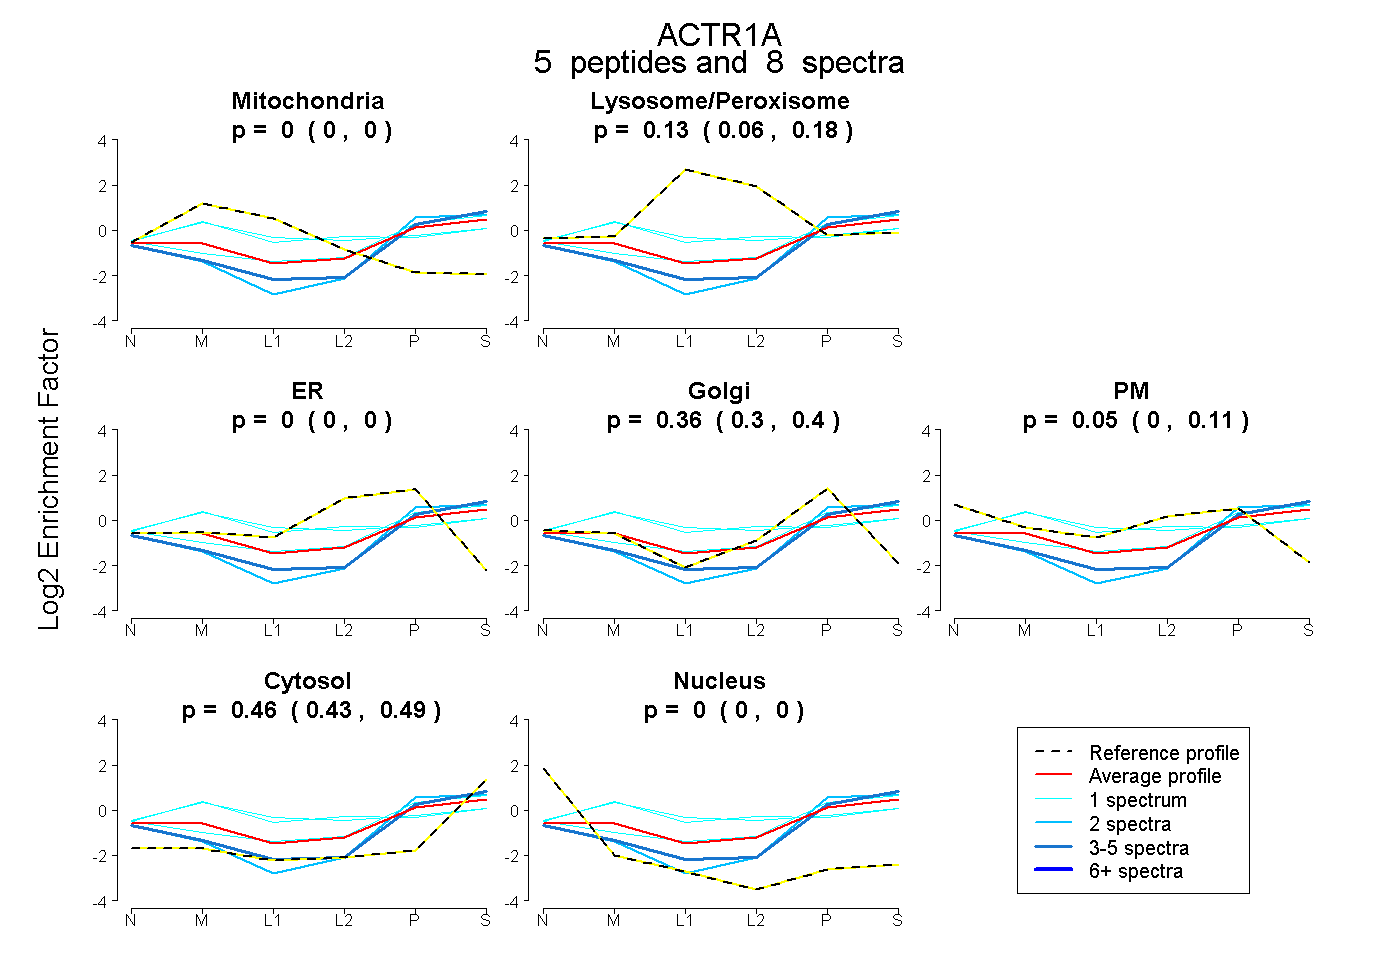 |
0.000 0.000 | 0.000 |
0.127 0.063 | 0.176 |
0.000 0.000 | 0.000 |
0.358 0.299 | 0.402 |
0.053 0.000 | 0.114 |
0.462 0.426 | 0.491 |
0.000 0.000 | 0.000 |
|||
| Plot | Lyso | Other | |||||||||||
| Expt C |
9 peptides |
18 spectra |
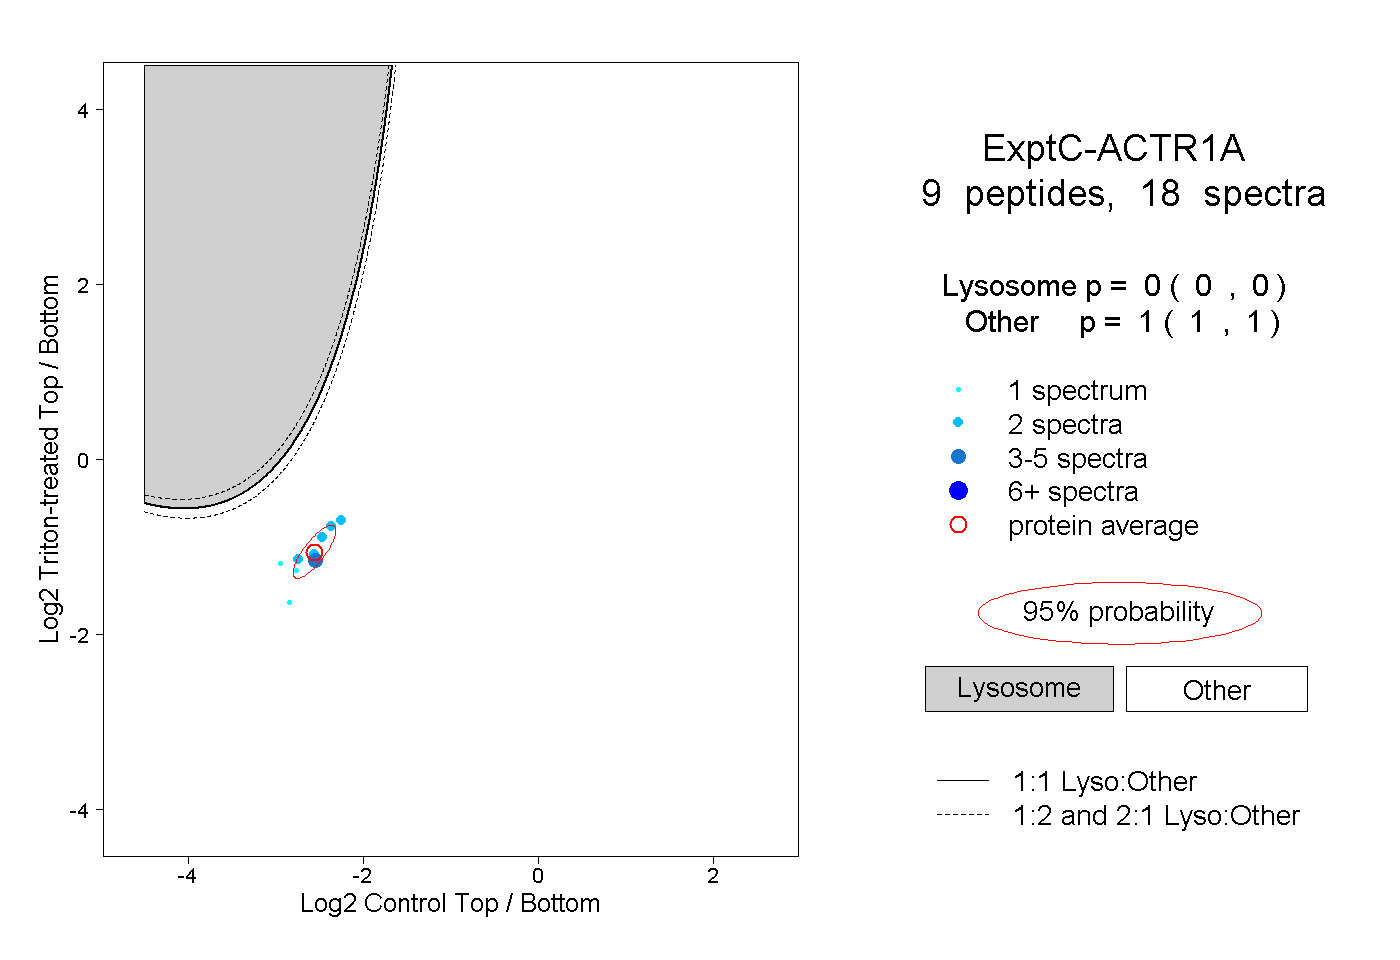 |
0.000 0.000 | 0.000 |
1.000 1.000 | 1.000 |