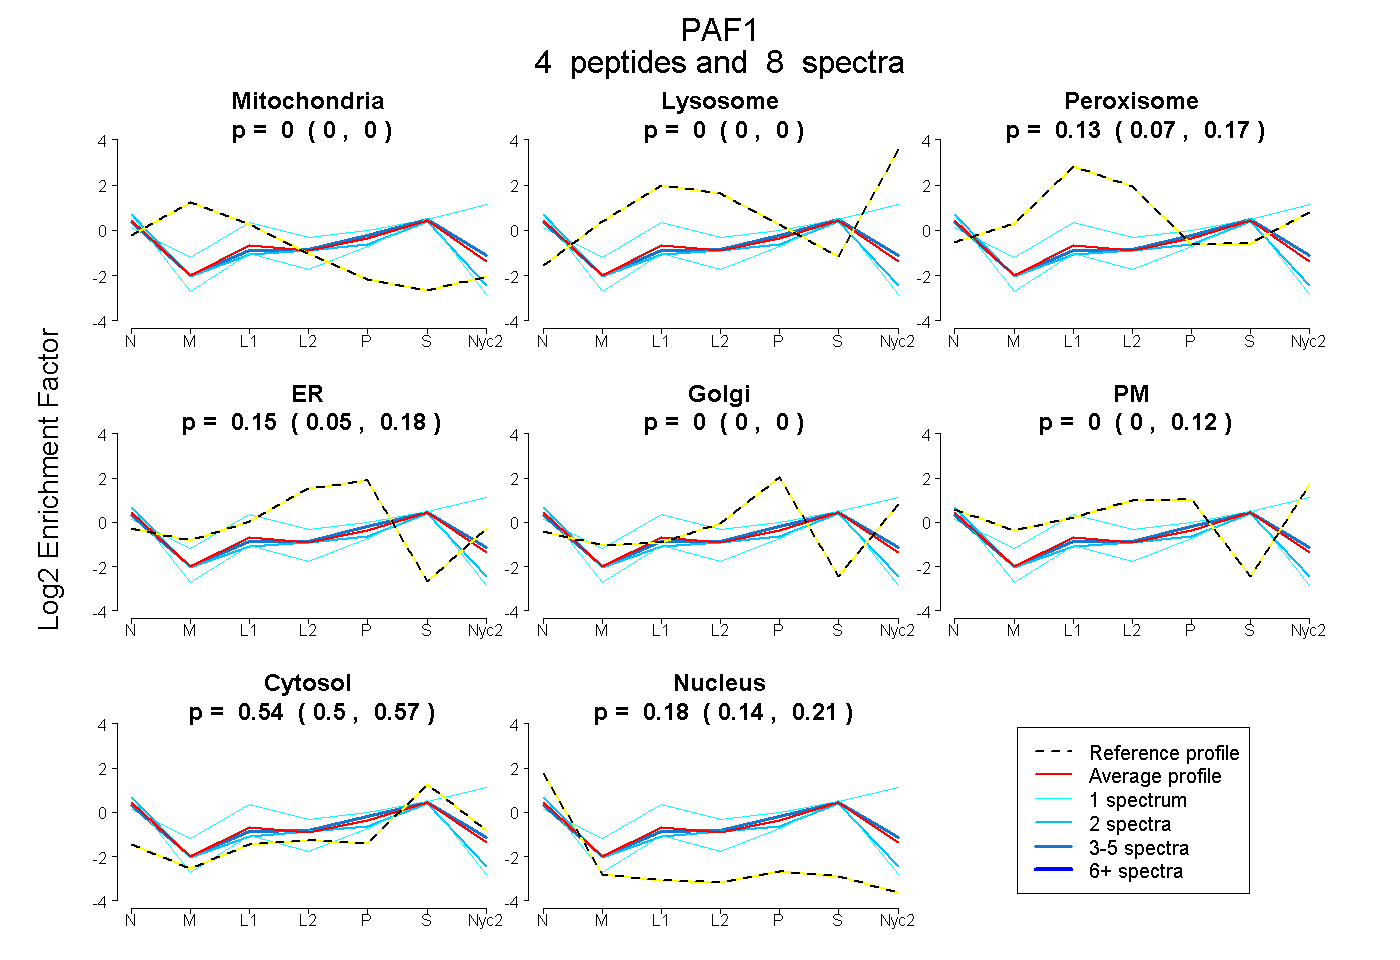
 4
4peptides
spectra
0.000 | 0.000
0.000 | 0.000
0.067 | 0.167
0.051 | 0.180
0.000 | 0.000
0.000 | 0.119
0.504 | 0.571
0.138 | 0.205
2peptides
spectra
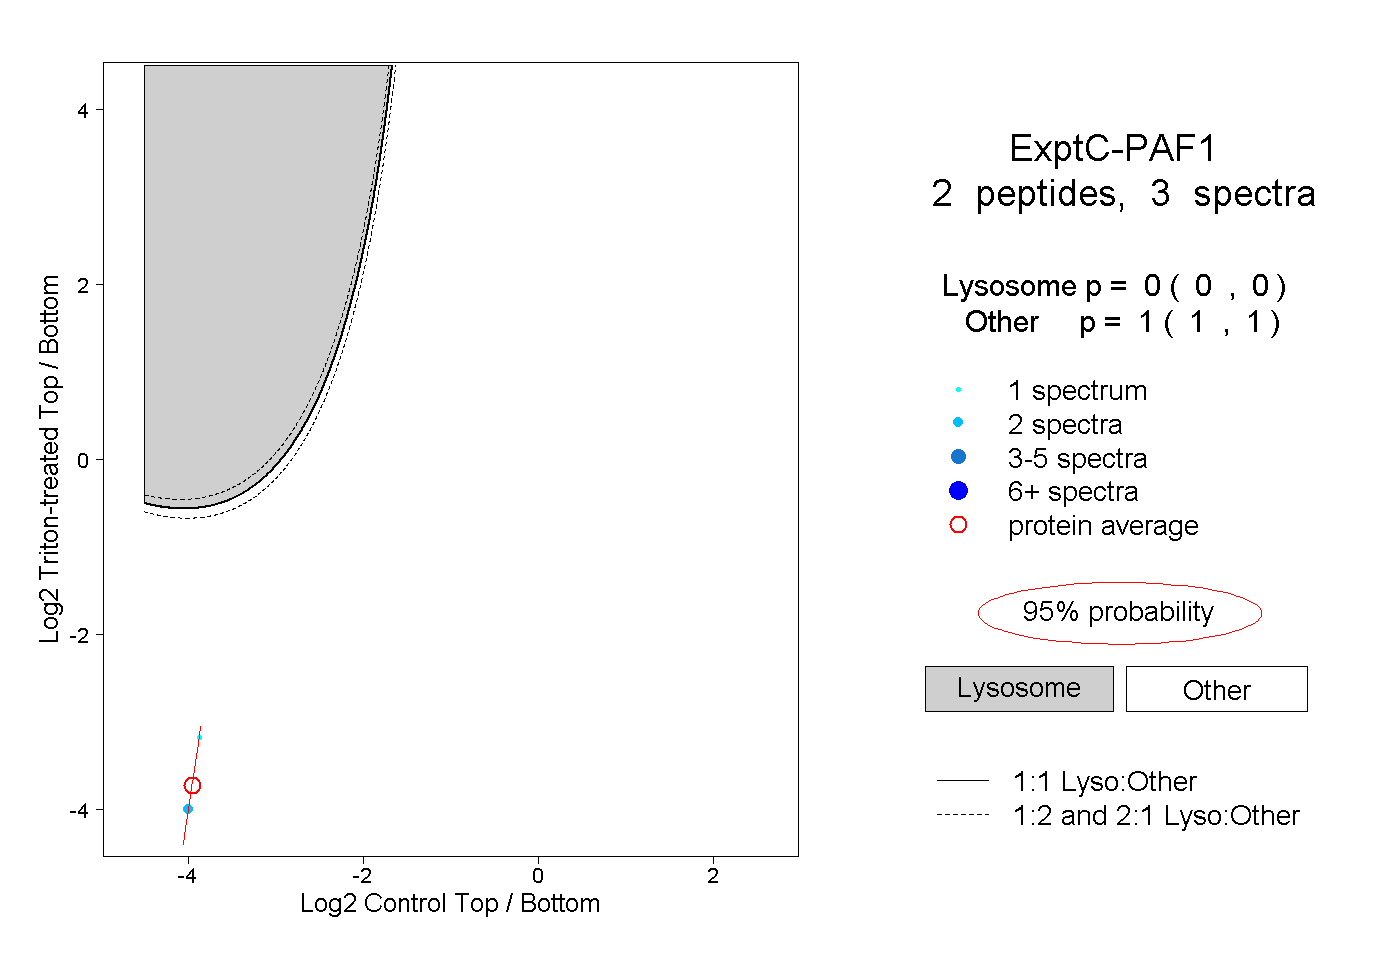
0.000 | 0.000
1.000 | 1.000
| Plot | Mito | Lyso | Perox | ER | Golgi | PM | Cytosol | Nucleus | |||||
| Expt A |
4 peptides |
8 spectra |
|
0.000 0.000 | 0.000 |
0.000 0.000 | 0.000 |
0.131 0.067 | 0.167 |
0.154 0.051 | 0.180 |
0.000 0.000 | 0.000 |
0.000 0.000 | 0.119 |
0.539 0.504 | 0.571 |
0.176 0.138 | 0.205 |
||
| Plot | Lyso | Other | |||||||||||
| Expt C |
2 peptides |
3 spectra |
|
0.000 0.000 | 0.000 |
1.000 1.000 | 1.000 |