 13
13peptides
spectra
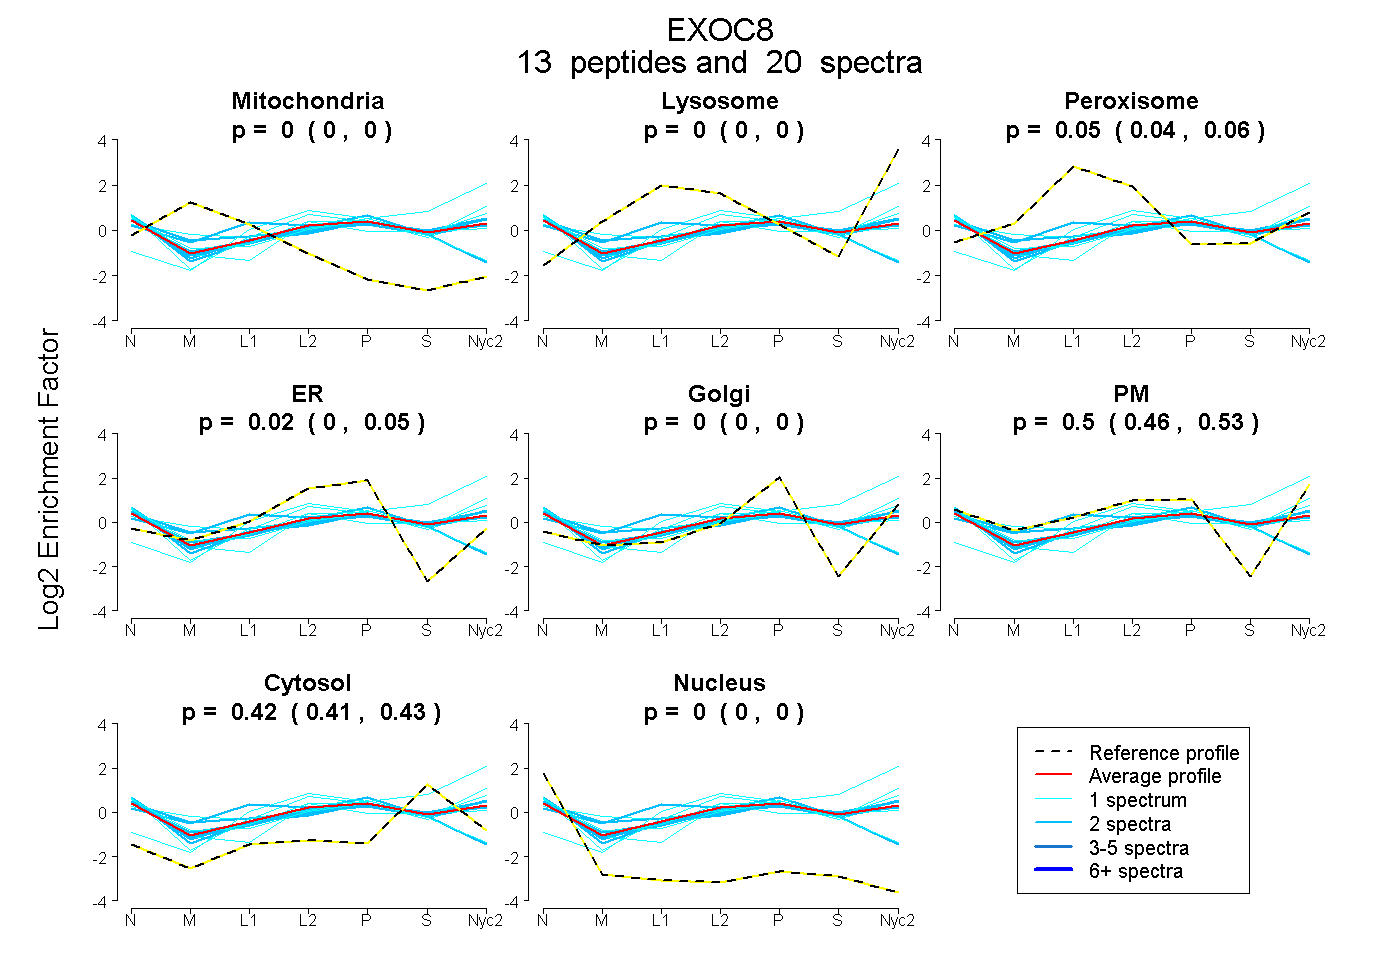
0.000 | 0.000
0.000 | 0.000
0.043 | 0.063
0.000 | 0.050
0.000 | 0.000
0.462 | 0.532
0.414 | 0.427
0.000 | 0.000
4peptides
spectra
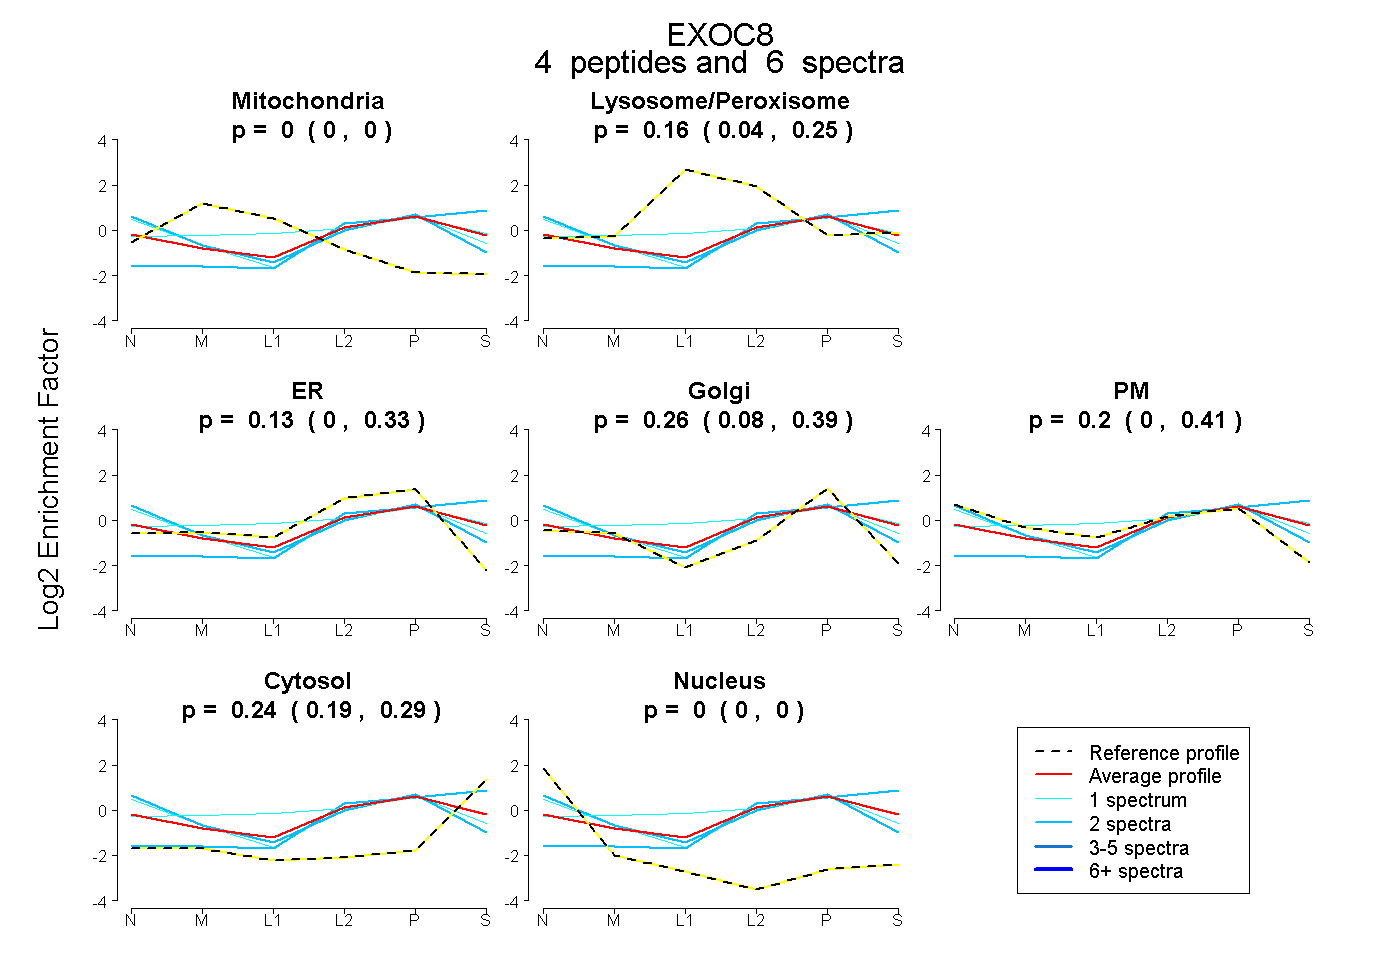
0.000 | 0.000
0.036 | 0.251
0.000 | 0.329
0.081 | 0.388
0.000 | 0.408
0.188 | 0.294
0.000 | 0.000
16peptides
spectra
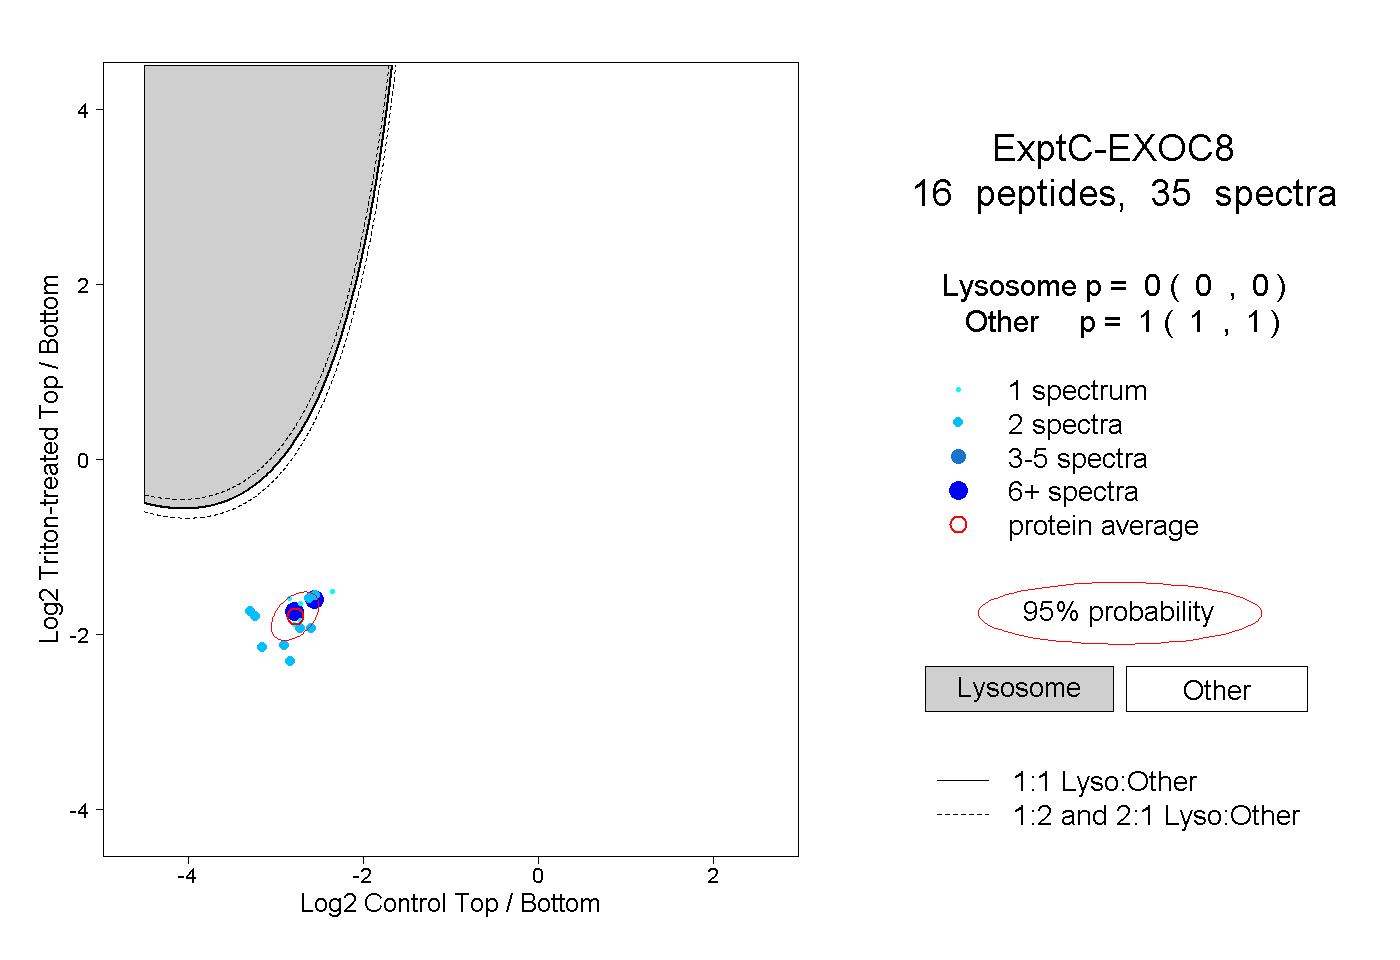
0.000 | 0.000
1.000 | 1.000
1peptide
spectra
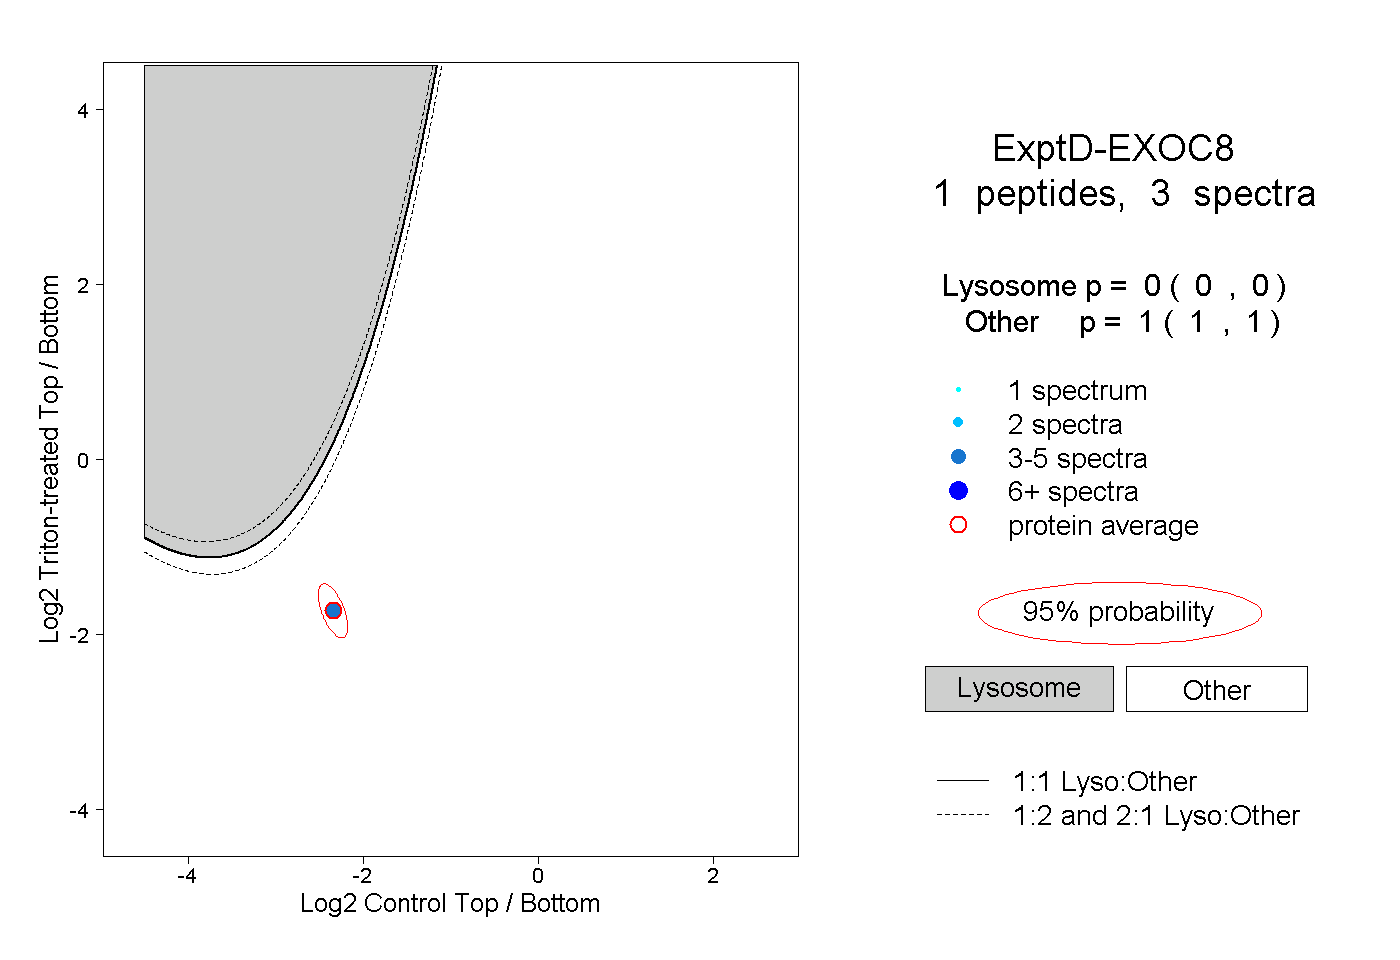
0.000 | 0.000
1.000 | 1.000