EXOC8
[ENSRNOP00000026757]
Main page
| | | Plot |
Mito |
Lyso |
|
Perox |
ER |
Golgi |
PM |
Cytosol |
Nucleus |
|
| Expt A |
 13
13
peptides |
20
spectra |
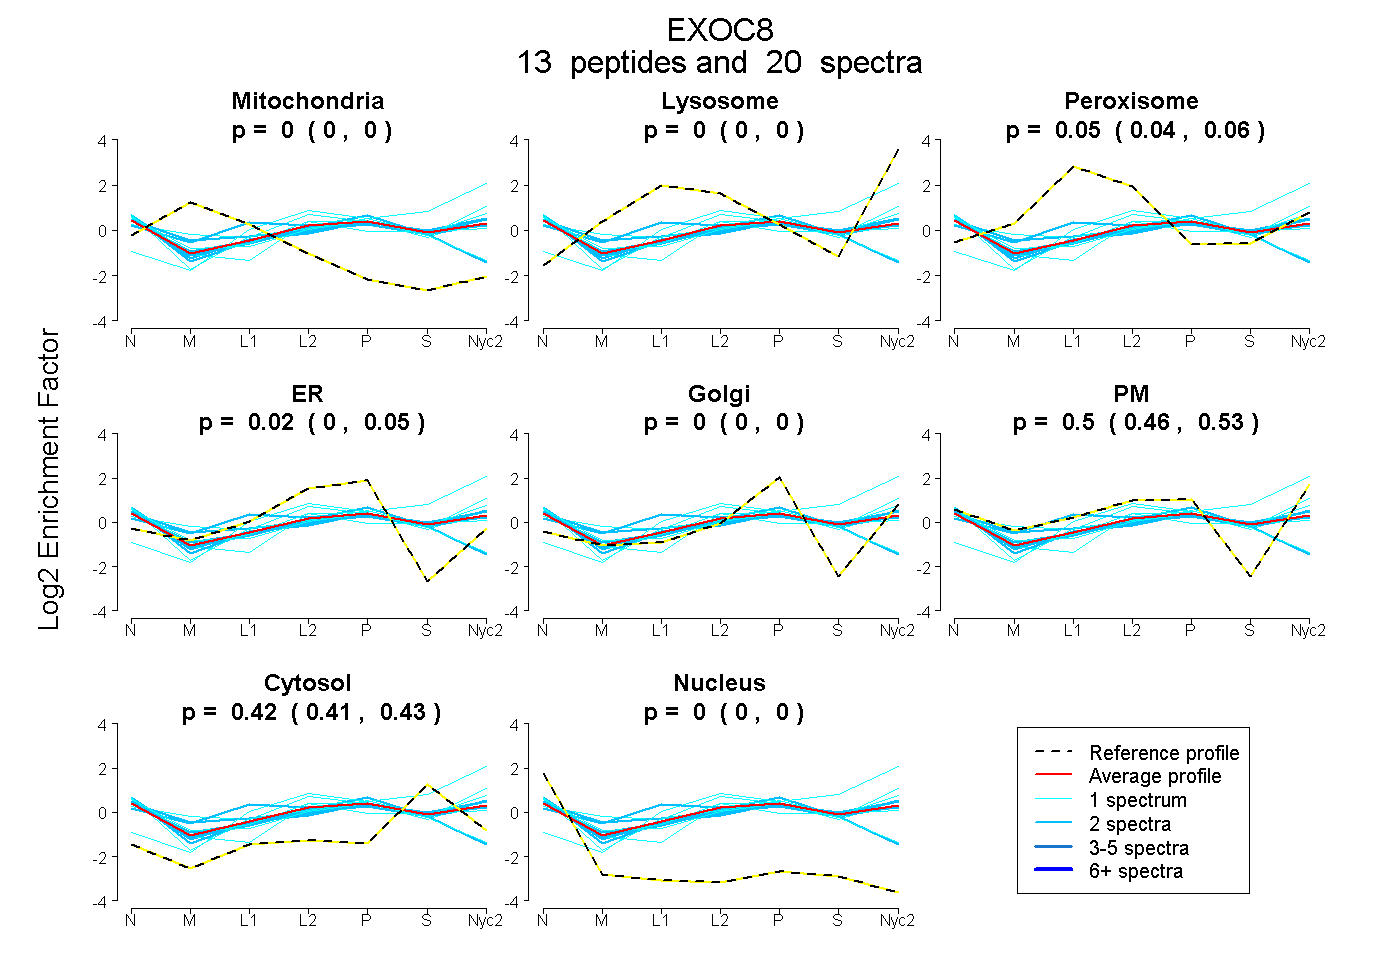 |
0.000
0.000 | 0.000 |
0.000
0.000 | 0.000 |
|
0.054
0.043 | 0.063 |
0.021
0.000 | 0.050 |
0.000
0.000 | 0.000 |
0.503
0.462 | 0.532 |
0.422
0.414 | 0.427 |
0.000
0.000 | 0.000 |
|
| | | Plot |
Mito |
|
Lyso or Perox |
|
ER |
Golgi |
PM |
Cytosol |
Nucleus |
|
| Expt B |
4
peptides |
6
spectra |
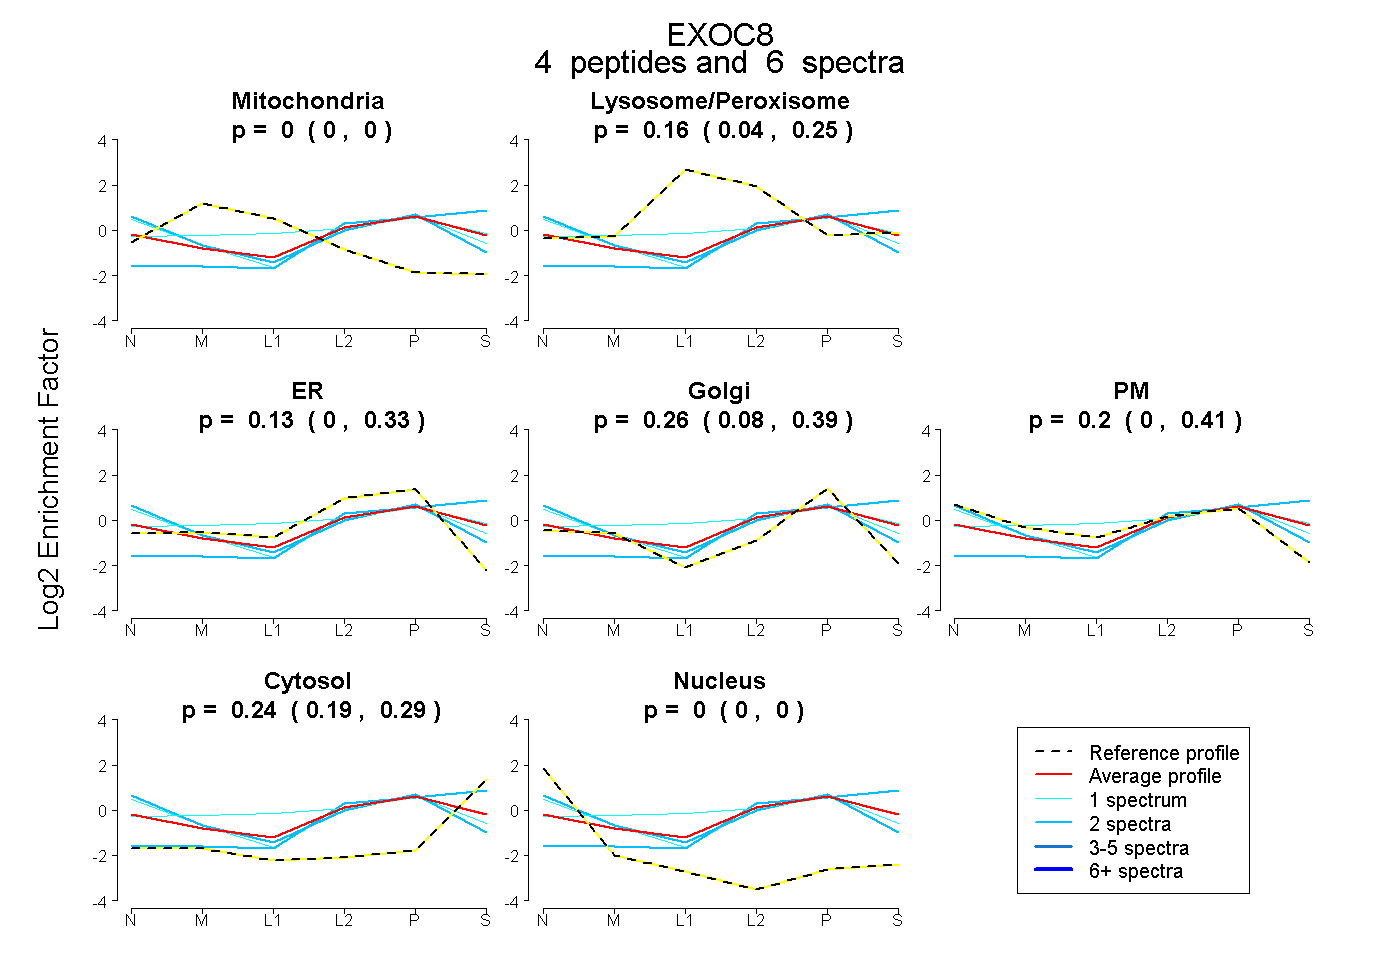 |
0.000
0.000 | 0.000 |
|
0.164
0.036 | 0.251 |
|
0.133
0.000 | 0.329 |
0.262
0.081 | 0.388 |
0.200
0.000 | 0.408 |
0.241
0.188 | 0.294 |
0.000
0.000 | 0.000 |
|
| | | Plot |
|
Lyso |
|
|
|
|
|
|
|
Other |
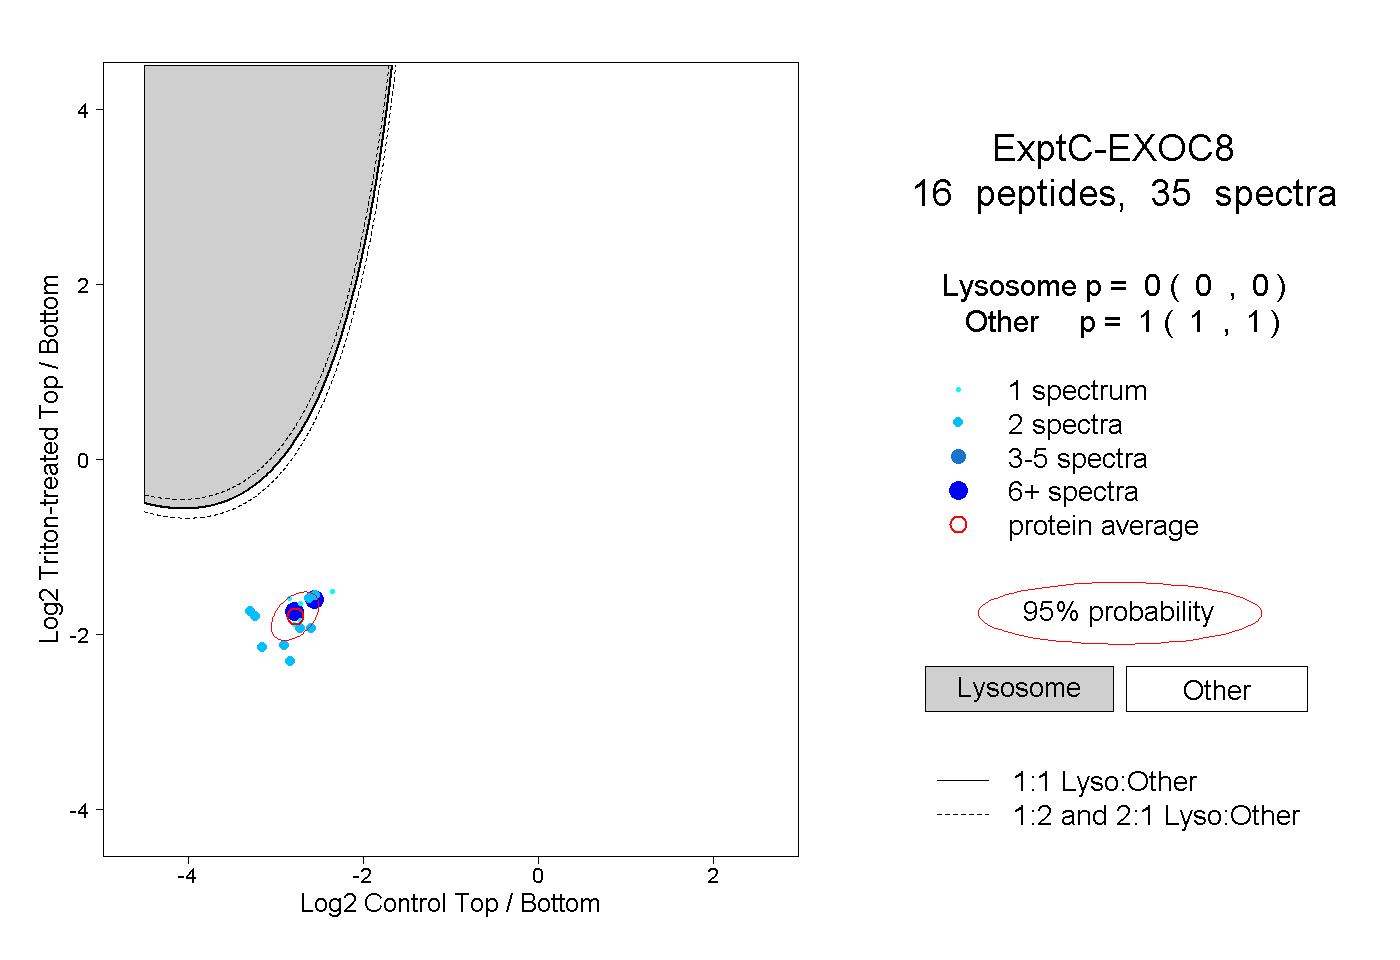
| Expt C |
16
peptides |
35
spectra |
 |
|
0.000
0.000 | 0.000 |
|
|
|
|
|
|
|
1.000
1.000 | 1.000 |
| 2 spectra, LGQCTK |
|
0.000 |
|
|
|
|
|
|
|
1.000 |
| 1 spectrum, LAVVNVK |
|
0.000 |
|
|
|
|
|
|
|
1.000 |
| 2 spectra, ACELFLR |
|
0.000 |
|
|
|
|
|
|
|
1.000 |
| 2 spectra, QVFDSK |
|
0.000 |
|
|
|
|
|
|
|
1.000 |
| 2 spectra, EIIIEATK |
|
0.000 |
|
|
|
|
|
|
|
1.000 |
| 2 spectra, YNALYPLDR |
|
0.000 |
|
|
|
|
|
|
|
1.000 |
| 1 spectrum, AAAVHTAIR |
|
0.000 |
|
|
|
|
|
|
|
1.000 |
| 1 spectrum, AVSQLIR |
|
0.000 |
|
|
|
|
|
|
|
1.000 |
| 2 spectra, LLMFPESR |
|
0.000 |
|
|
|
|
|
|
|
1.000 |
| 1 spectrum, QLQDLR |
|
0.000 |
|
|
|
|
|
|
|
1.000 |
| 6 spectra, EGPGTGEEGK |
|
0.000 |
|
|
|
|
|
|
|
1.000 |
| 1 spectrum, QFIETAR |
|
0.000 |
|
|
|
|
|
|
|
1.000 |
| 2 spectra, IEGATLLYIHK |
|
0.000 |
|
|
|
|
|
|
|
1.000 |
| 2 spectra, QLESGGFEAR |
|
0.000 |
|
|
|
|
|
|
|
1.000 |
| 2 spectra, IFQAENAK |
|
0.000 |
|
|
|
|
|
|
|
1.000 |
| 6 spectra, APPPVTSK |
|
0.000 |
|
|
|
|
|
|
|
1.000 |
| | | Plot |
|
Lyso |
|
|
|
|
|
|
|
Other |
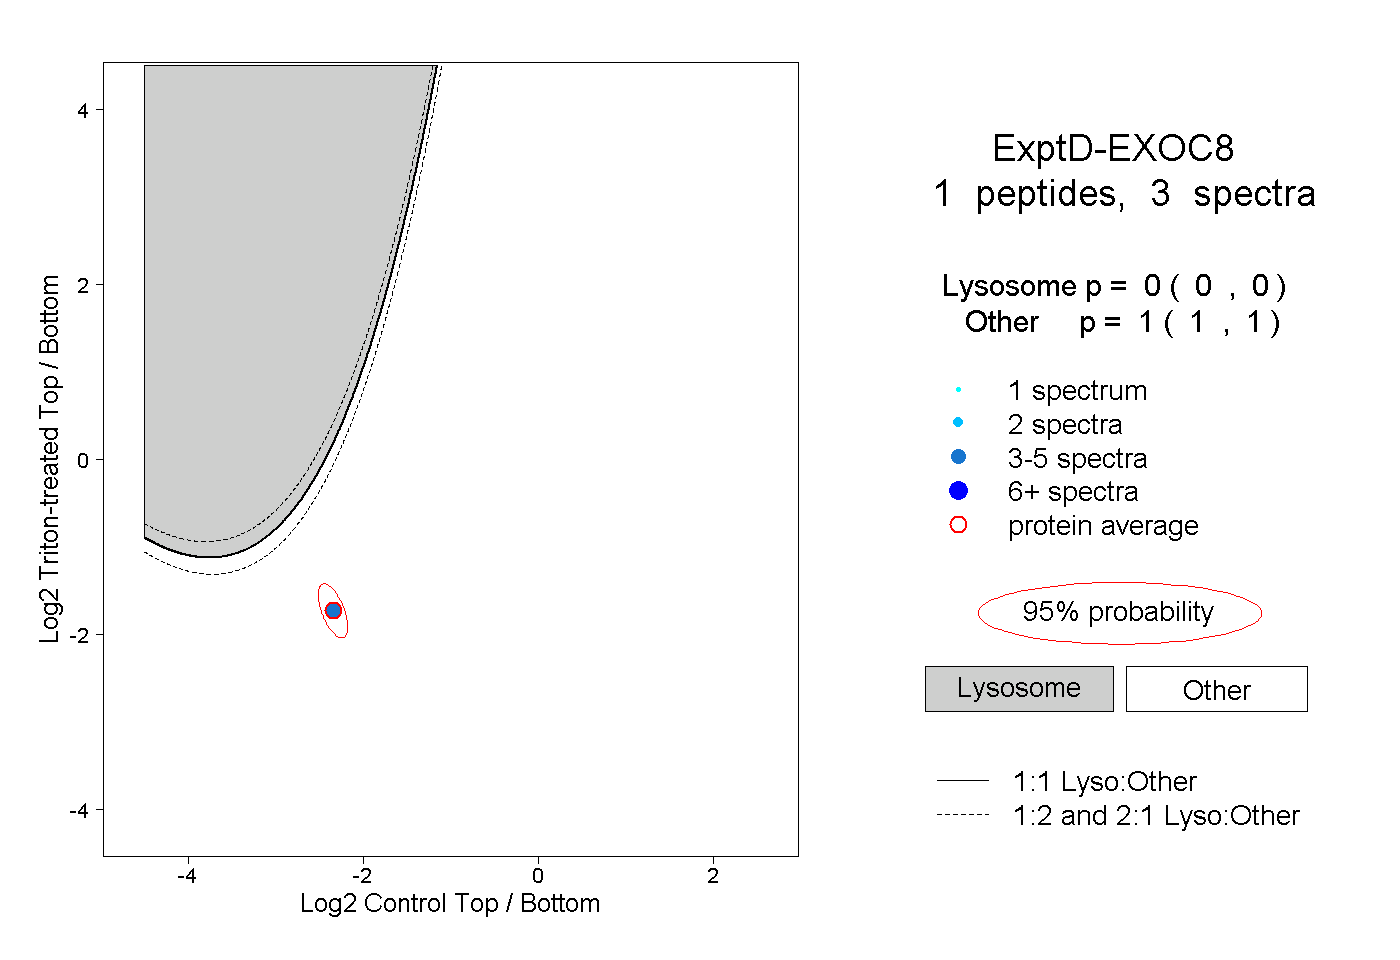
| Expt D |
1
peptide |
3
spectra |
 |
|
0.000
0.000 | 0.000 |
|
|
|
|
|
|
|
1.000
1.000 | 1.000 |