 10
10peptides
spectra
0.000 | 0.000
0.449 | 0.501
0.000 | 0.002
0.021 | 0.153
0.000 | 0.060
0.236 | 0.335
0.102 | 0.138
0.000 | 0.000
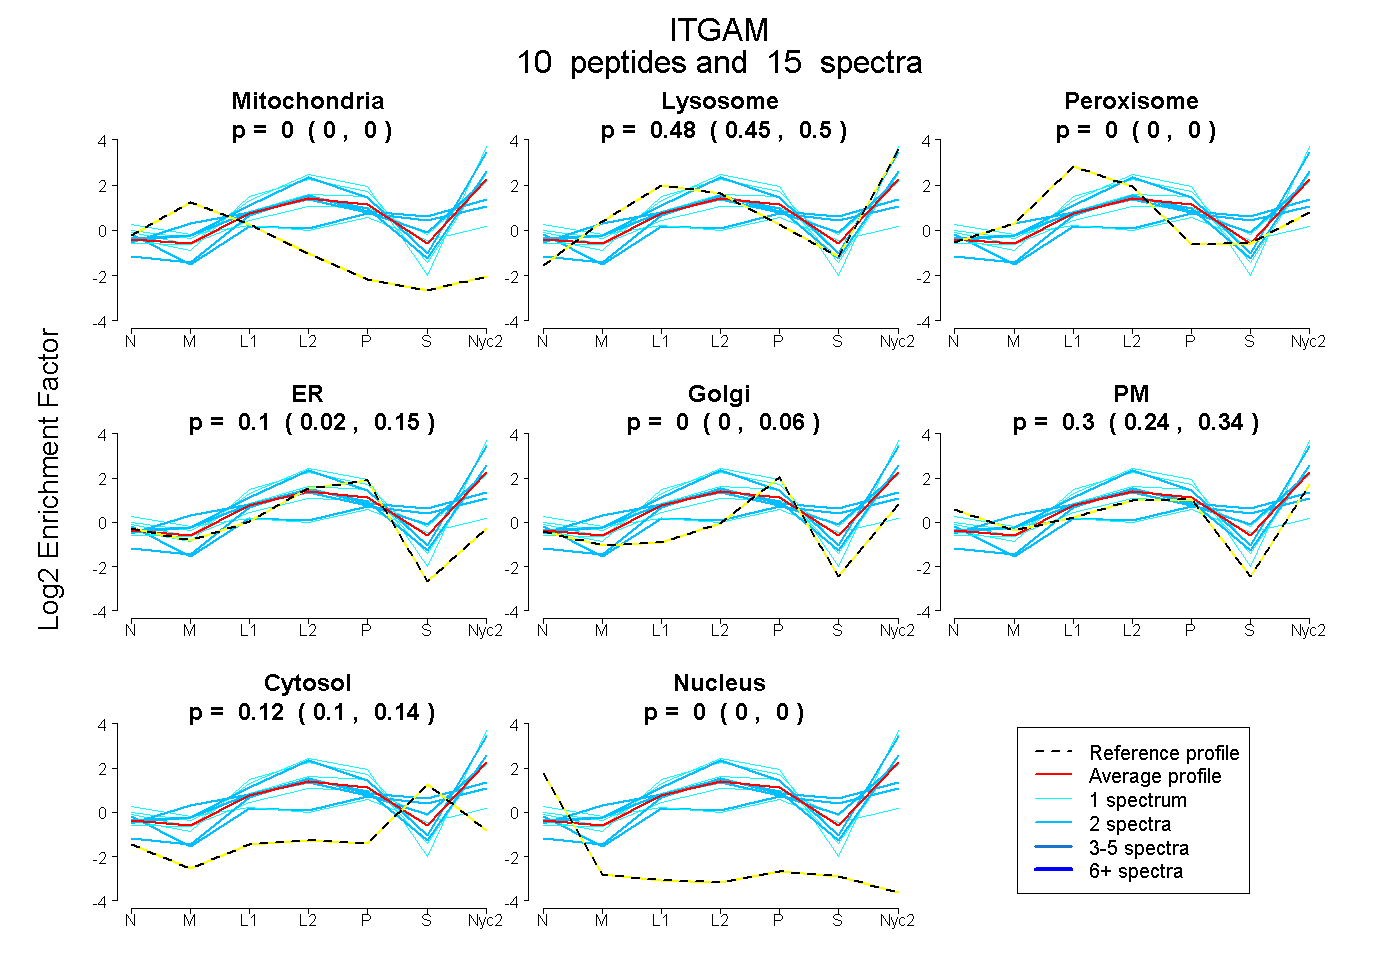
| Plot | Mito | Lyso | Perox | ER | Golgi | PM | Cytosol | Nucleus | |||||
| Expt A |
10 peptides |
15 spectra |
|
0.000 0.000 | 0.000 |
0.475 0.449 | 0.501 |
0.000 0.000 | 0.002 |
0.098 0.021 | 0.153 |
0.003 0.000 | 0.060 |
0.299 0.236 | 0.335 |
0.124 0.102 | 0.138 |
0.000 0.000 | 0.000 |
| 2 spectra, VCLHVR | 0.000 | 0.425 | 0.078 | 0.162 | 0.000 | 0.000 | 0.335 | 0.000 | ||
| 1 spectrum, DLRPVLAMEAQR | 0.000 | 0.381 | 0.000 | 0.000 | 0.000 | 0.414 | 0.205 | 0.000 | ||
| 2 spectra, VQSLVLGAPR | 0.000 | 0.668 | 0.000 | 0.018 | 0.000 | 0.313 | 0.000 | 0.000 | ||
| 2 spectra, DMMNEAAPQDGPPQ | 0.000 | 0.172 | 0.057 | 0.000 | 0.075 | 0.272 | 0.423 | 0.000 | ||
| 1 spectrum, AQPVLR | 0.000 | 0.660 | 0.000 | 0.057 | 0.000 | 0.283 | 0.000 | 0.000 | ||
| 2 spectra, VIQHQYQFNNLGQR | 0.000 | 0.538 | 0.000 | 0.030 | 0.054 | 0.367 | 0.011 | 0.000 | ||
| 1 spectrum, DAGEVR | 0.000 | 0.388 | 0.000 | 0.068 | 0.006 | 0.538 | 0.000 | 0.000 | ||
| 1 spectrum, ILVVITDGEK | 0.000 | 0.624 | 0.000 | 0.058 | 0.000 | 0.318 | 0.000 | 0.000 | ||
| 2 spectra, KPQQFPEALR | 0.000 | 0.487 | 0.074 | 0.000 | 0.000 | 0.271 | 0.167 | 0.000 | ||
| 1 spectrum, IQCDIPSFNSK | 0.077 | 0.000 | 0.235 | 0.000 | 0.221 | 0.234 | 0.233 | 0.000 |
| Plot | Mito | Lyso or Perox | ER | Golgi | PM | Cytosol | Nucleus | ||||||
| Expt B |
1 peptide |
1 spectrum |
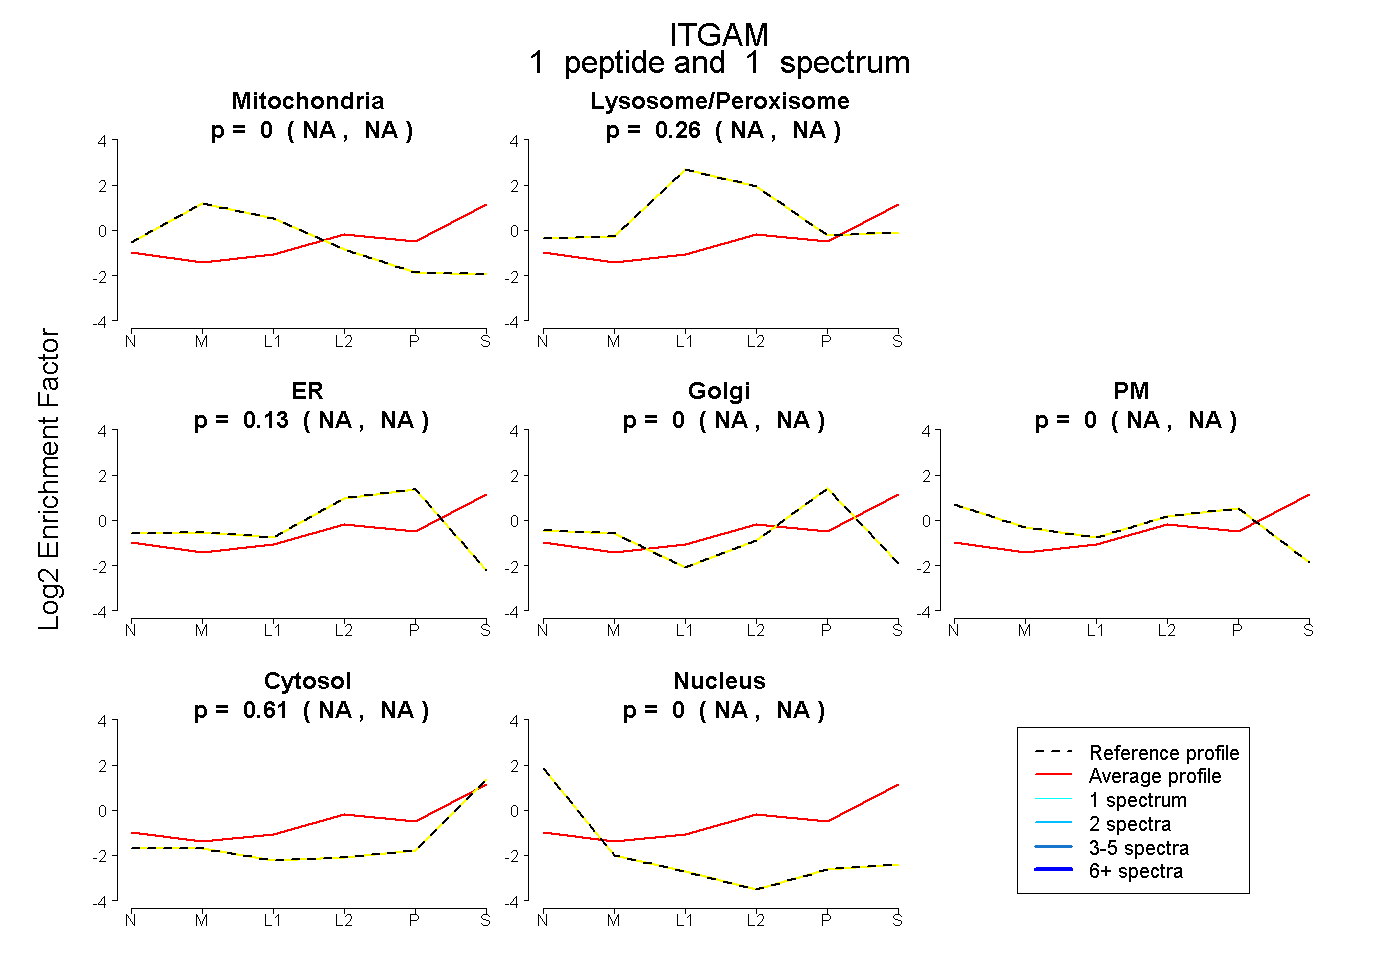 |
0.000 NA | NA |
0.255 NA | NA |
0.135 NA | NA |
0.000 NA | NA |
0.000 NA | NA |
0.610 NA | NA |
0.000 NA | NA |
|||
| Plot | Lyso | Other | |||||||||||
| Expt C |
15 peptides |
39 spectra |
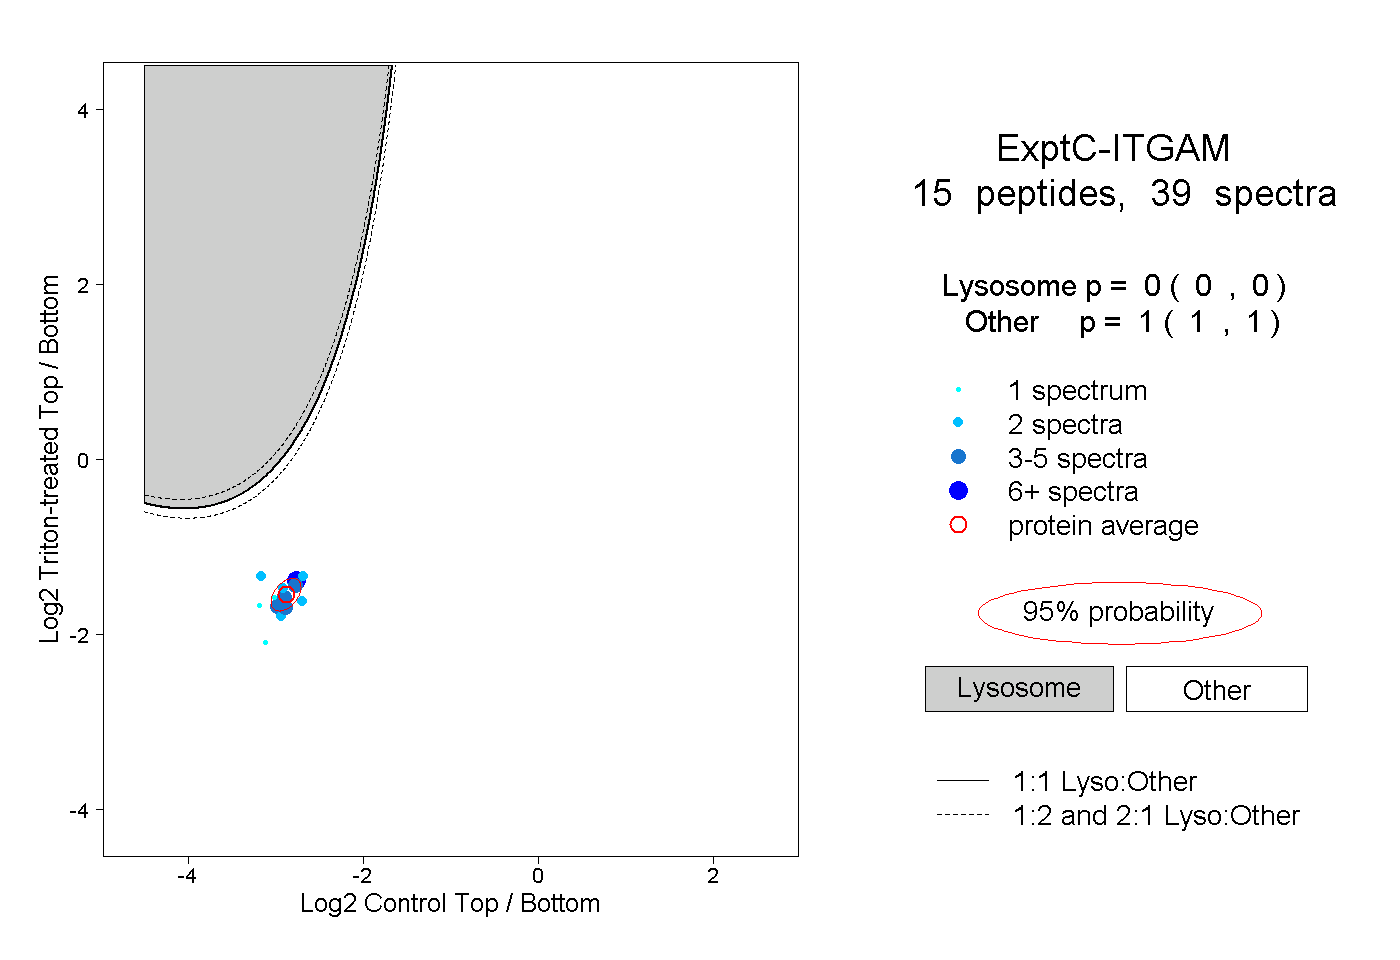 |
0.000 0.000 | 0.000 |
1.000 1.000 | 1.000 |
||||||||
| Plot | Lyso | Other | |||||||||||
| Expt D |
3 peptides |
5 spectra |
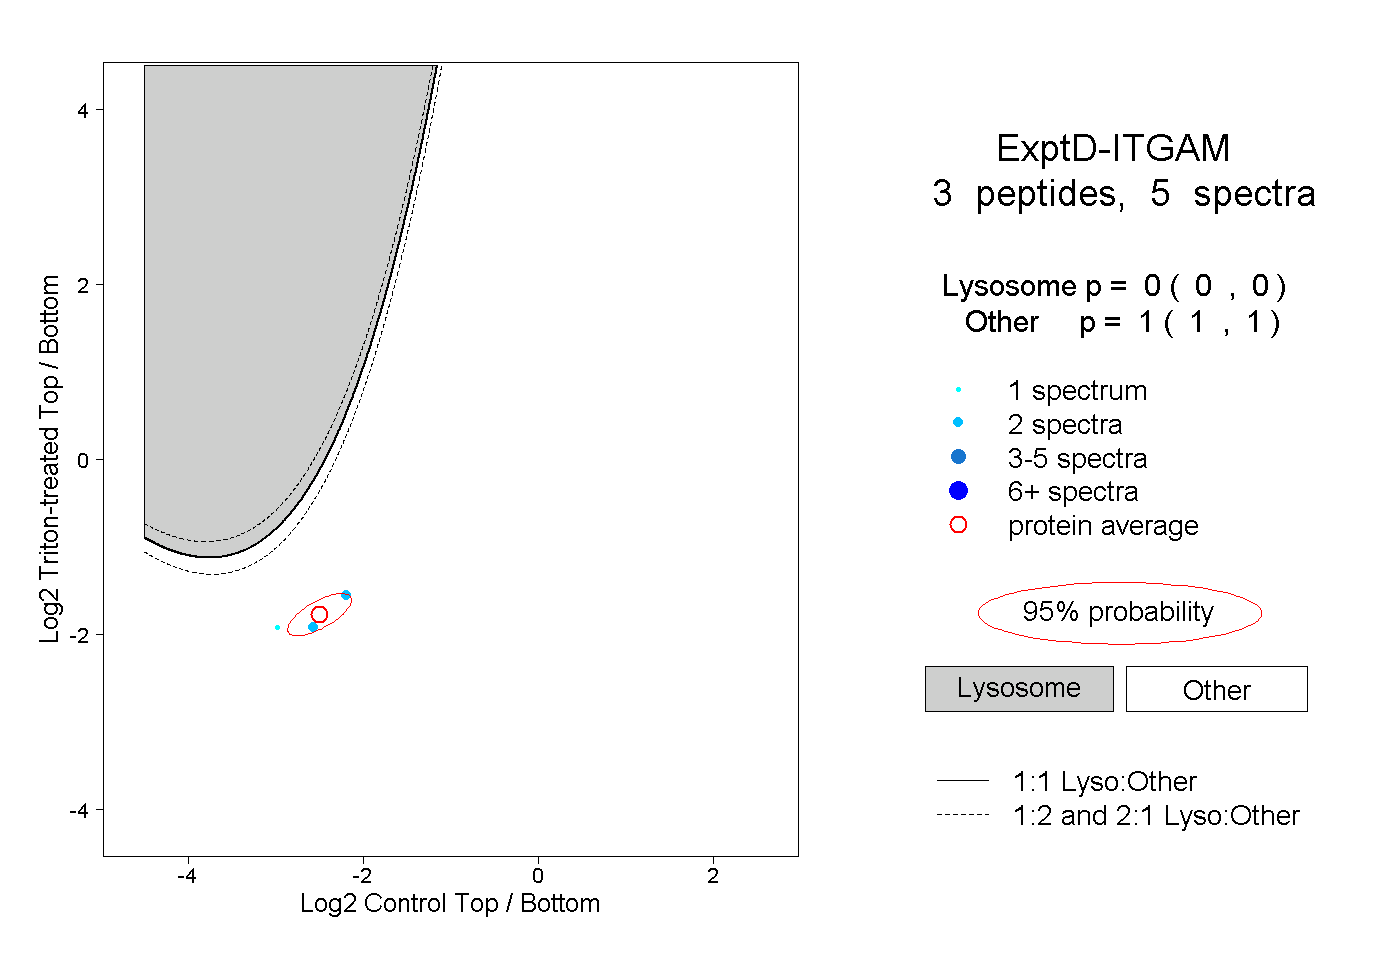 |
0.000 0.000 | 0.000 |
1.000 1.000 | 1.000 |