 7
7peptides
spectra
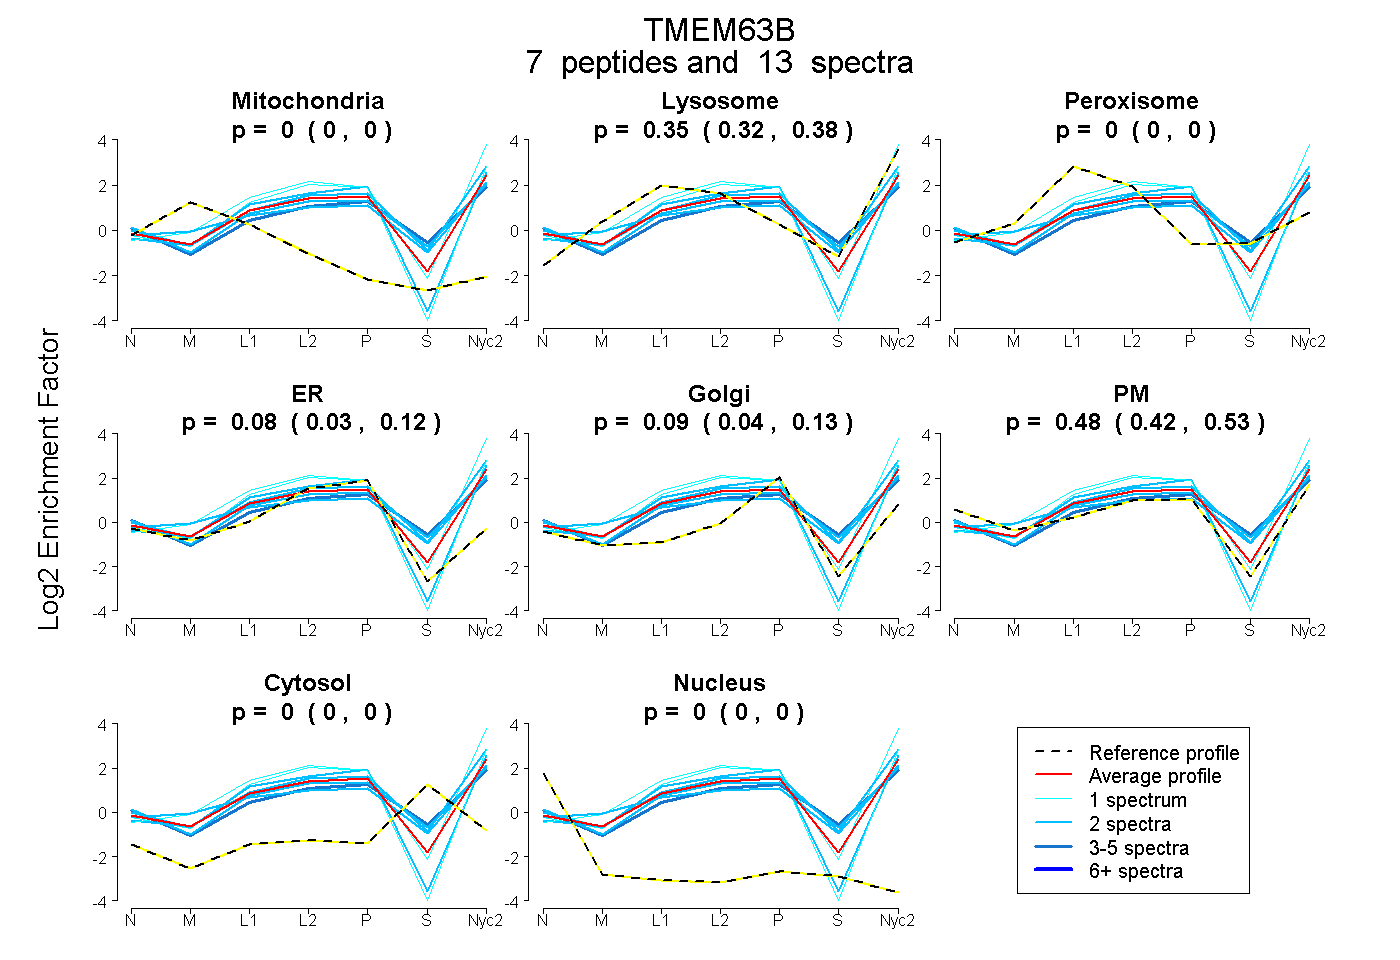
0.000 | 0.000
0.318 | 0.382
0.000 | 0.000
0.029 | 0.124
0.036 | 0.127
0.421 | 0.535
0.000 | 0.000
0.000 | 0.000
10peptides
spectra
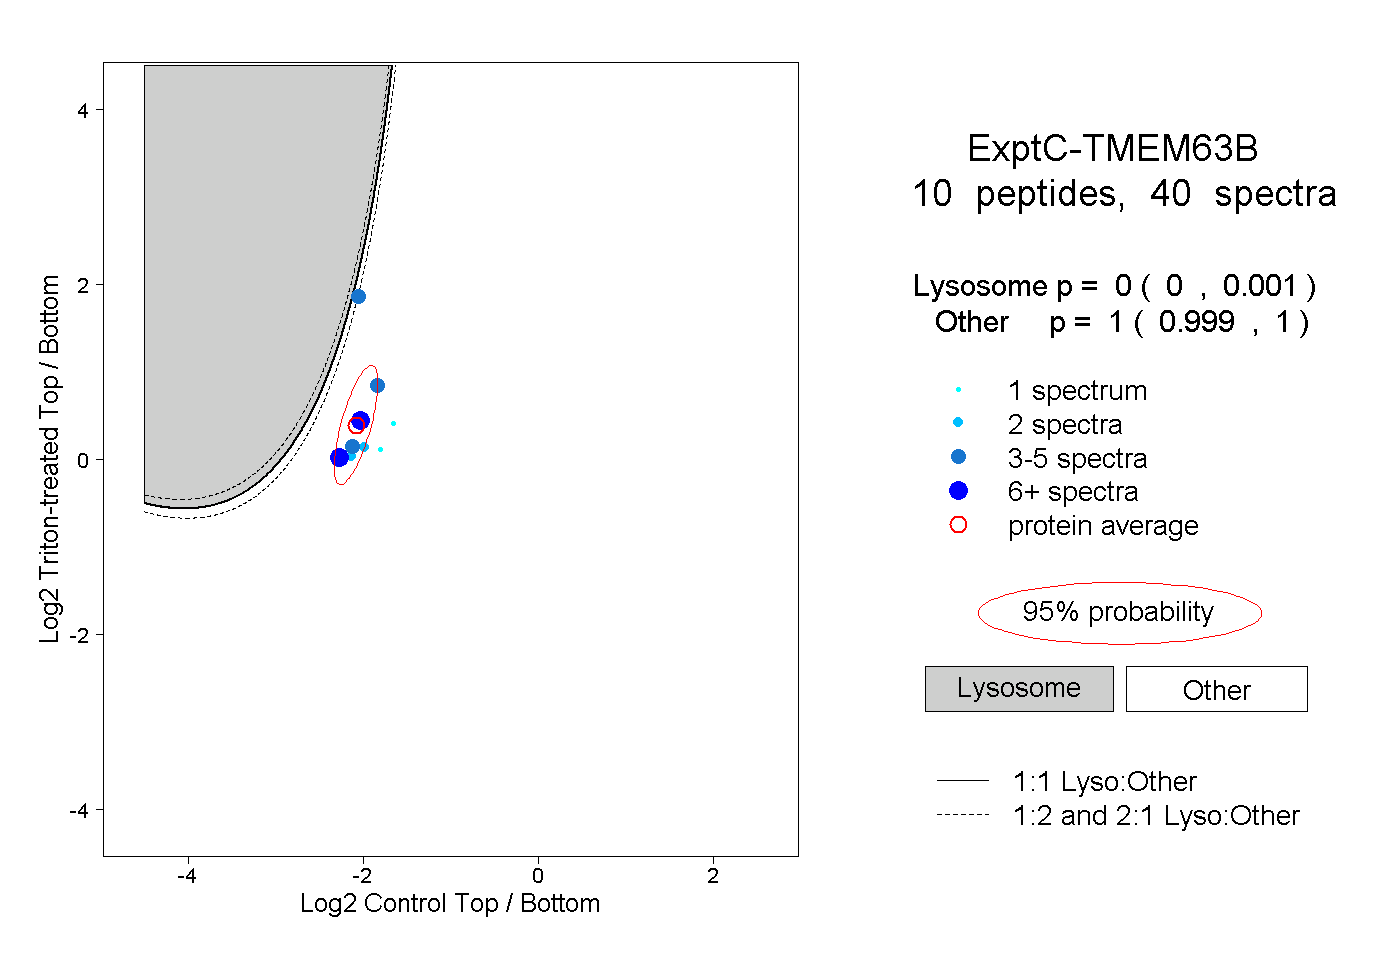
0.000 | 0.001
0.999 | 1.000
1peptide
spectrum
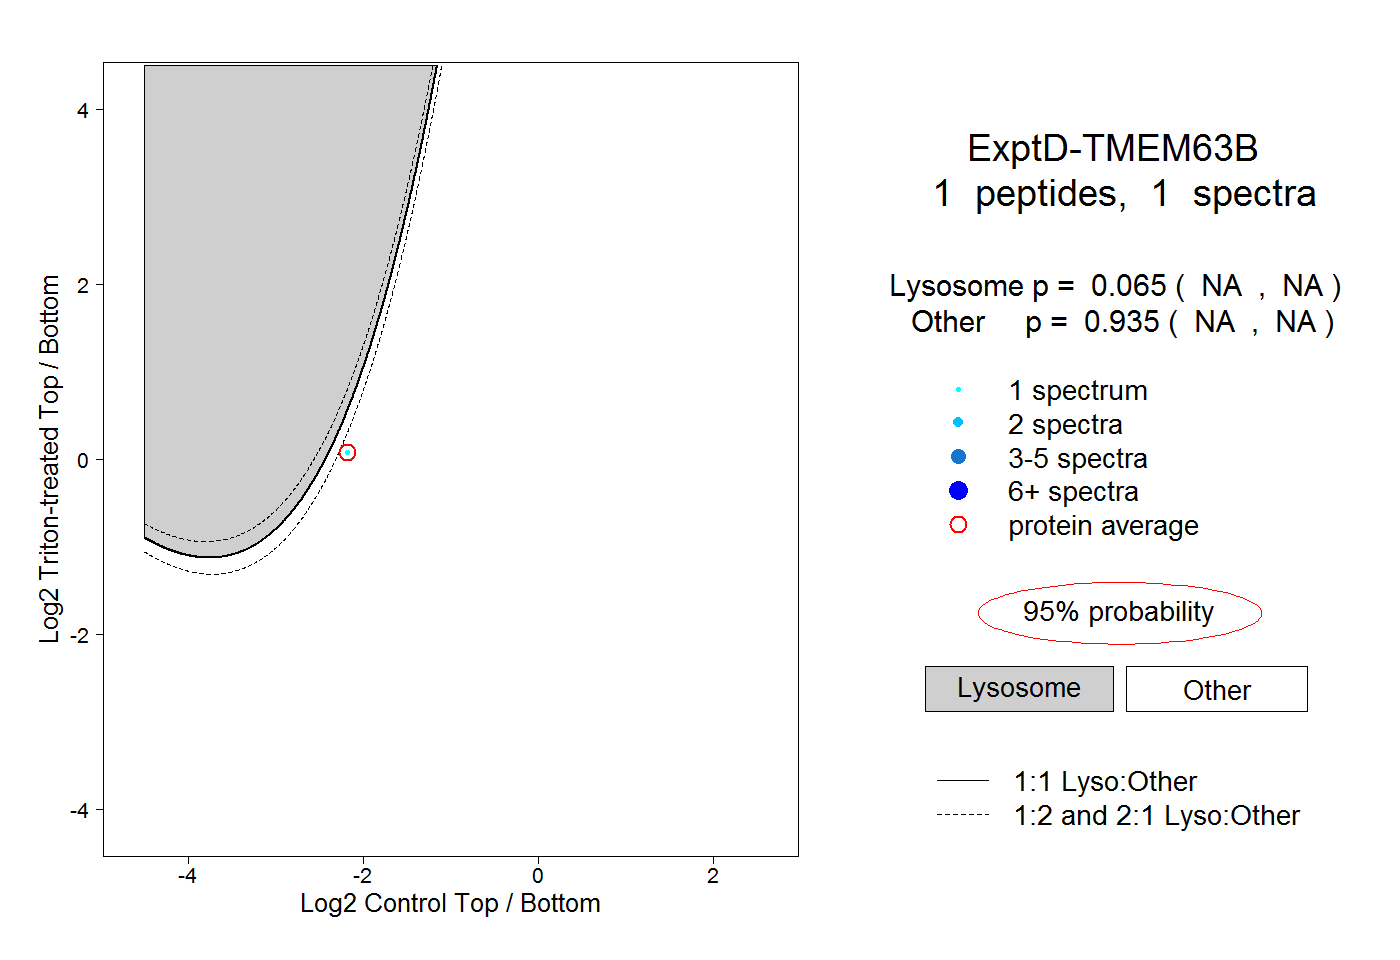
NA | NA
NA | NA