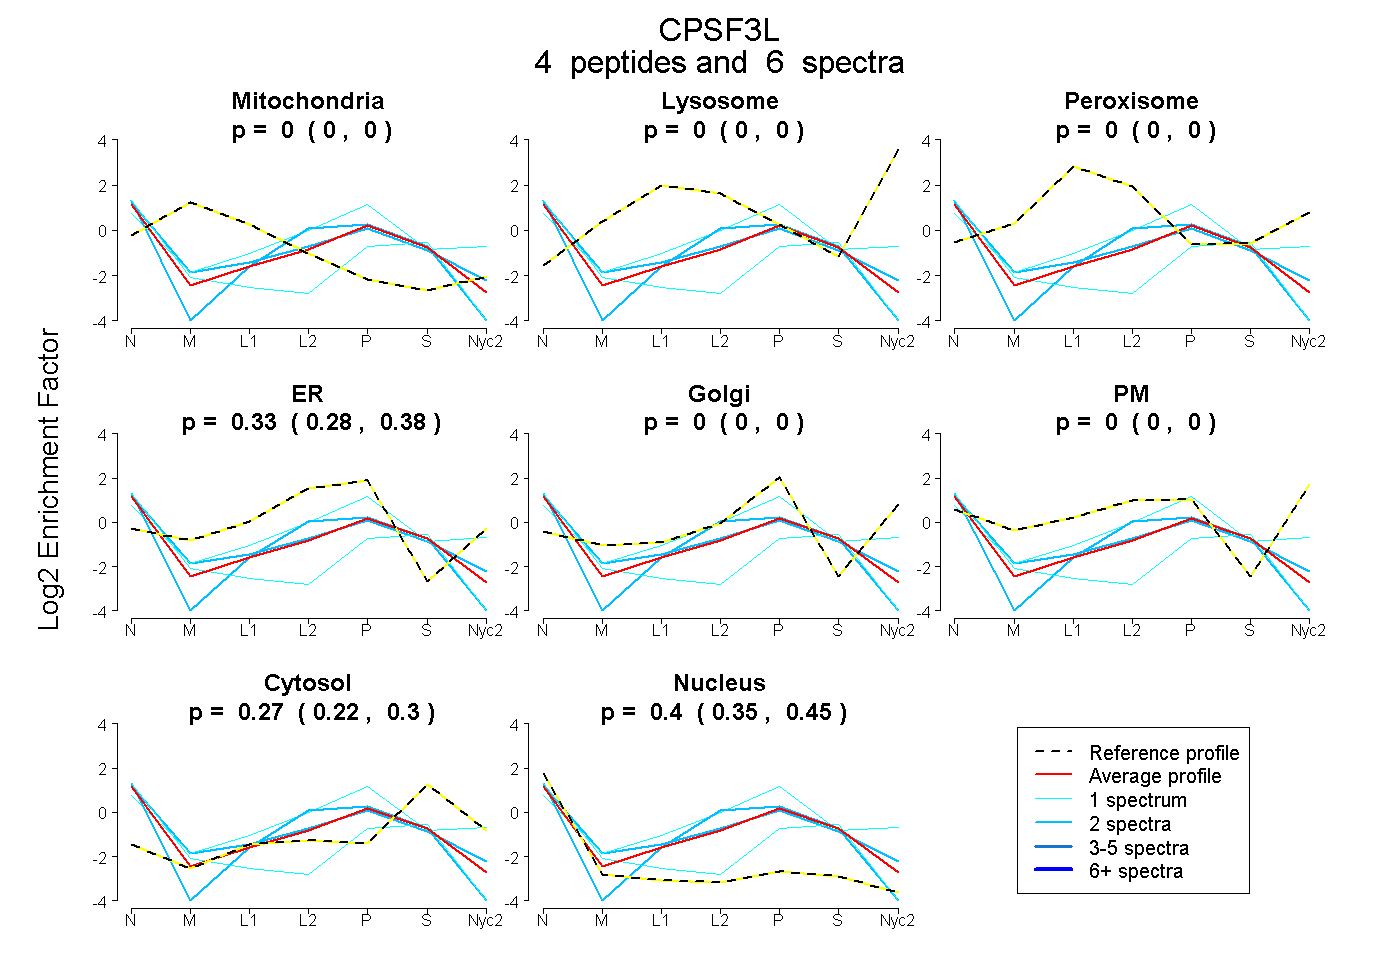
 4
4peptides
spectra
0.000 | 0.000
0.000 | 0.000
0.000 | 0.000
0.276 | 0.379
0.000 | 0.000
0.000 | 0.000
0.224 | 0.298
0.350 | 0.448
| Plot | Mito | Lyso | Perox | ER | Golgi | PM | Cytosol | Nucleus | |||||
| Expt A |
4 peptides |
6 spectra |
|
0.000 0.000 | 0.000 |
0.000 0.000 | 0.000 |
0.000 0.000 | 0.000 |
0.334 0.276 | 0.379 |
0.000 0.000 | 0.000 |
0.000 0.000 | 0.000 |
0.265 0.224 | 0.298 |
0.401 0.350 | 0.448 |
| 1 spectrum, VTPLGAGQDVGR | 0.000 | 0.000 | 0.000 | 0.037 | 0.000 | 0.000 | 0.301 | 0.662 | ||
| 2 spectra, VHETVER | 0.000 | 0.000 | 0.000 | 0.311 | 0.000 | 0.000 | 0.226 | 0.463 | ||
| 1 spectrum, LFITWTNQK | 0.000 | 0.000 | 0.000 | 0.386 | 0.193 | 0.036 | 0.264 | 0.121 | ||
| 2 spectra, ILSGQR | 0.000 | 0.000 | 0.000 | 0.393 | 0.000 | 0.000 | 0.242 | 0.366 |
| Plot | Mito | Lyso or Perox | ER | Golgi | PM | Cytosol | Nucleus | ||||||
| Expt B |
2 peptides |
2 spectra |
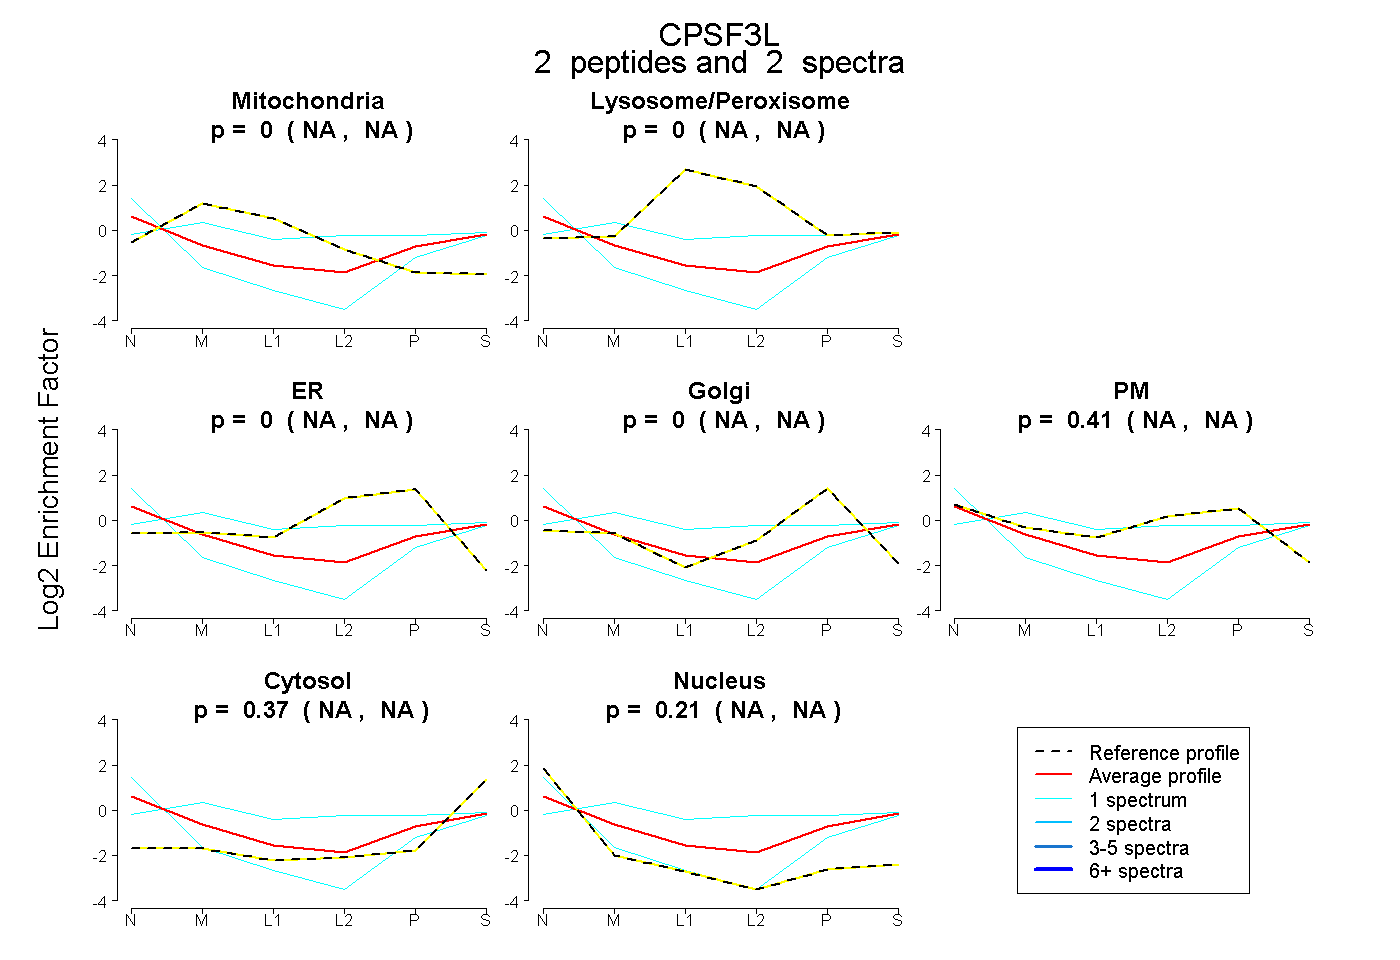 |
0.004 NA | NA |
0.005 NA | NA |
0.000 NA | NA |
0.000 NA | NA |
0.413 NA | NA |
0.372 NA | NA |
0.207 NA | NA |