8
8peptides
spectra
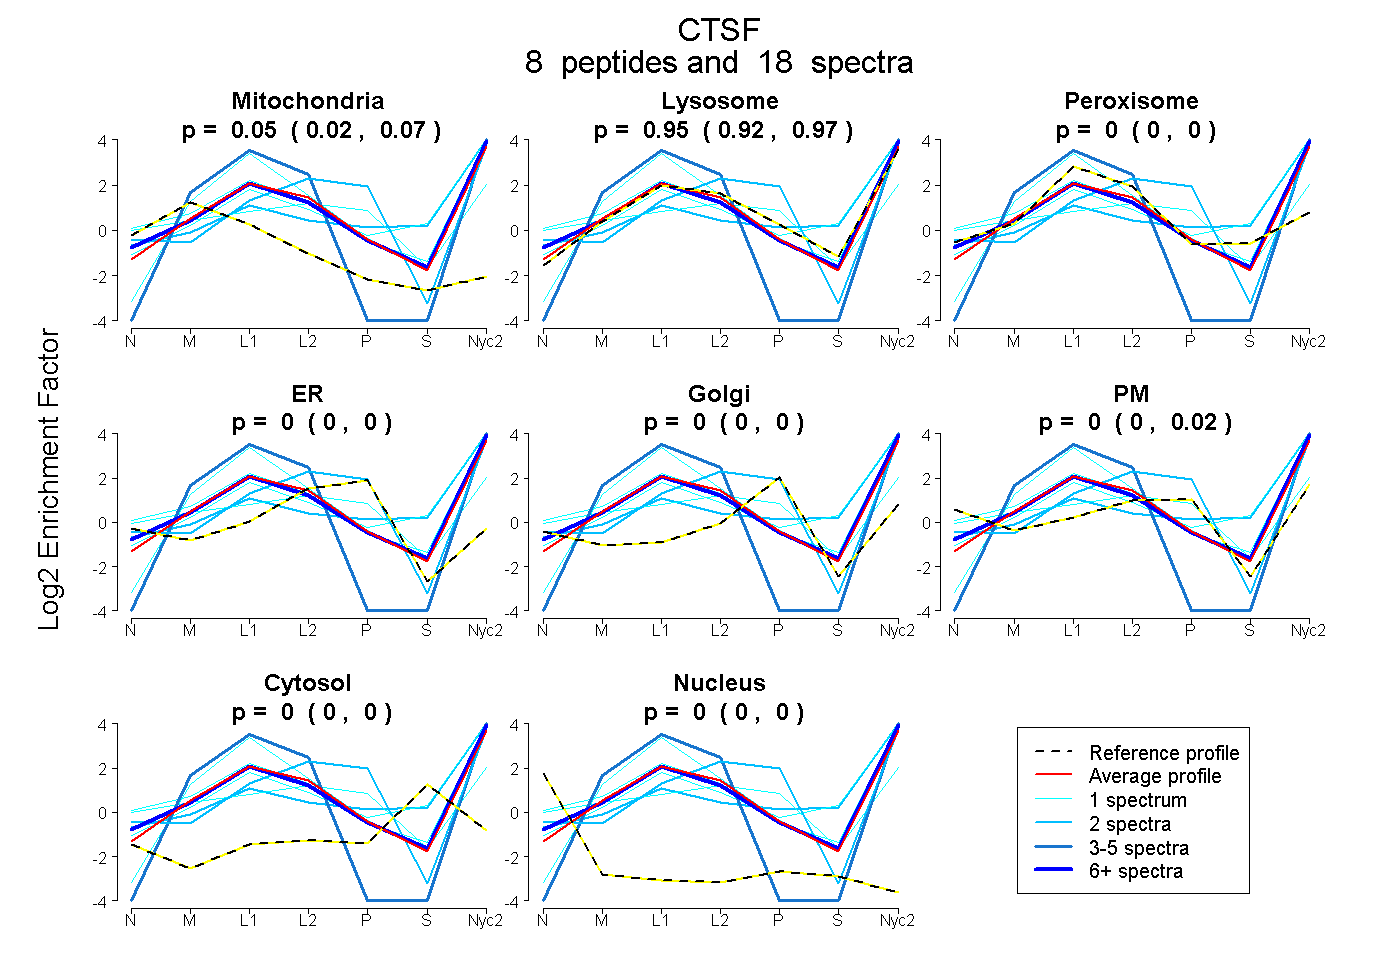
0.021 | 0.065
0.923 | 0.970
0.000 | 0.000
0.000 | 0.000
0.000 | 0.000
0.000 | 0.023
0.000 | 0.000
0.000 | 0.000
7peptides
spectra
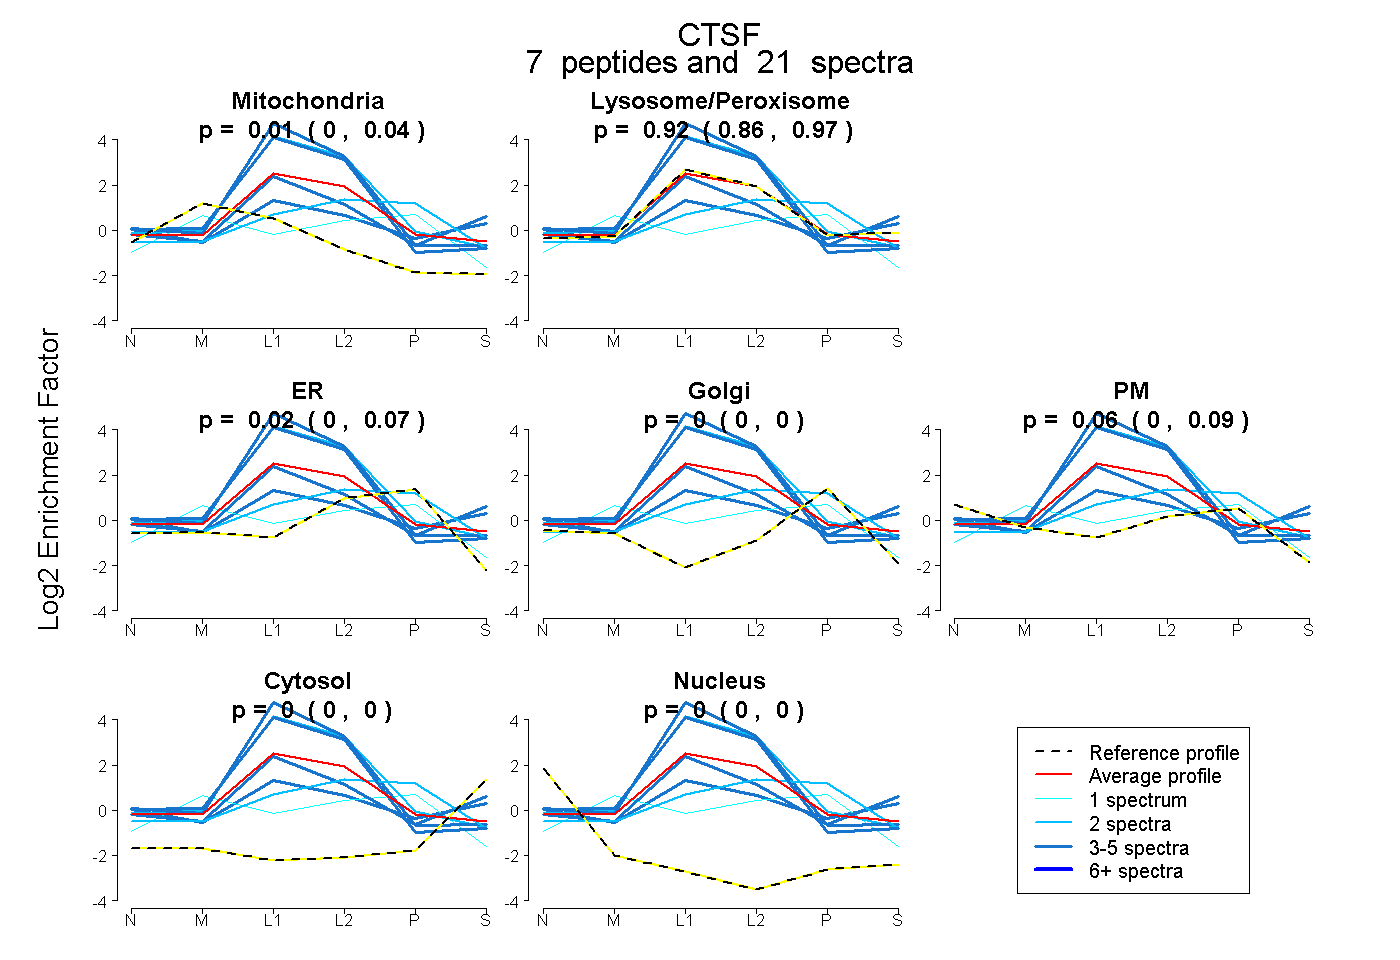
0.000 | 0.038
0.861 | 0.968
0.000 | 0.068
0.000 | 0.000
0.000 | 0.094
0.000 | 0.000
0.000 | 0.000