 8
8peptides
spectra
0.021 | 0.065
0.923 | 0.970
0.000 | 0.000
0.000 | 0.000
0.000 | 0.000
0.000 | 0.023
0.000 | 0.000
0.000 | 0.000
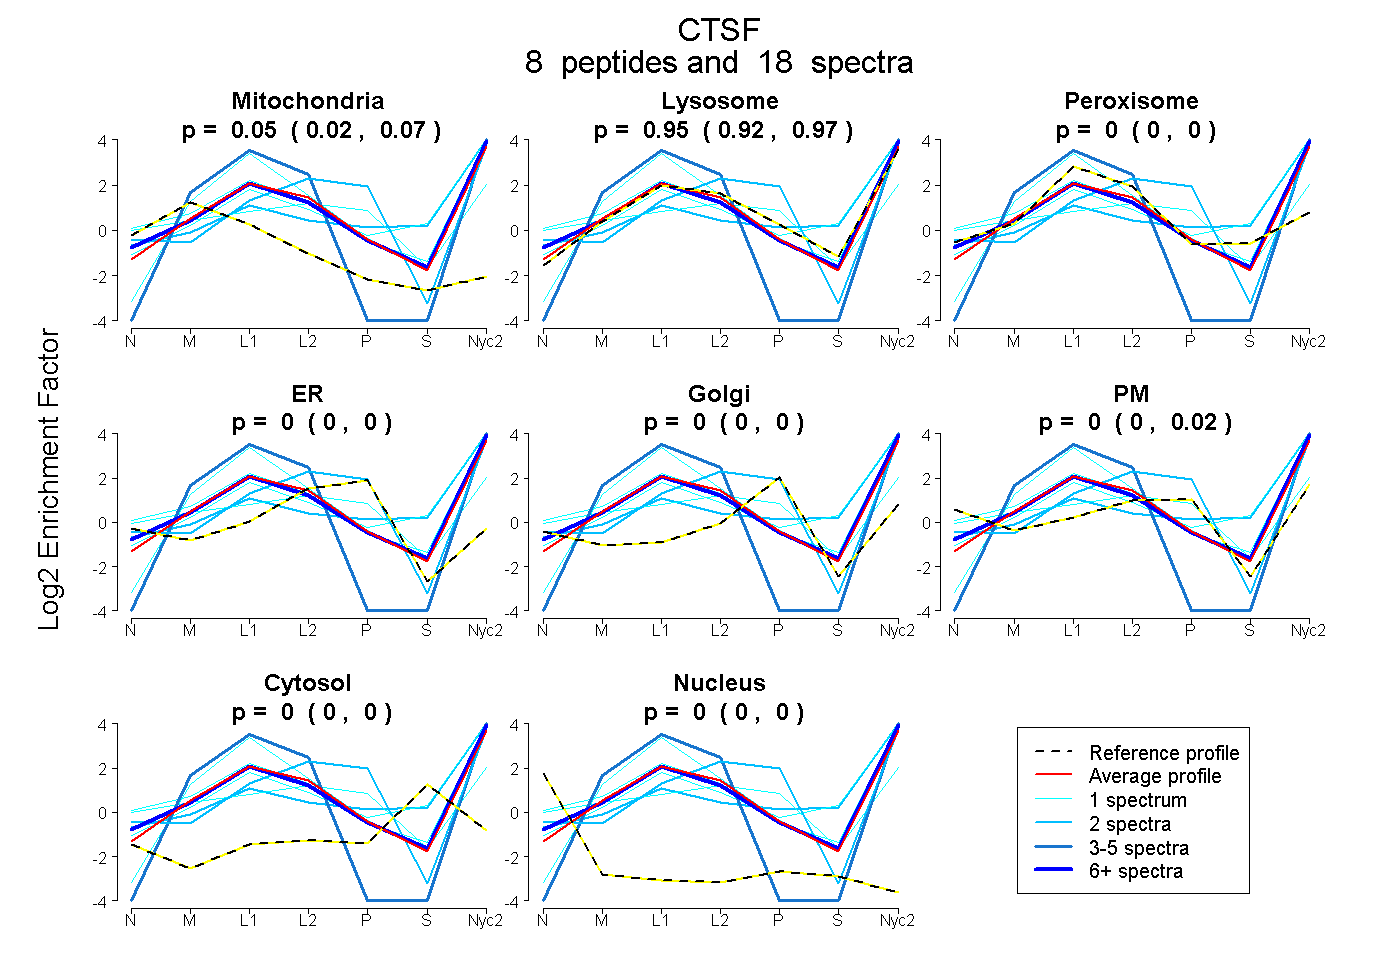
| Plot | Mito | Lyso | Perox | ER | Golgi | PM | Cytosol | Nucleus | |||||
| Expt A |
8 peptides |
18 spectra |
|
0.048 0.021 | 0.065 |
0.952 0.923 | 0.970 |
0.000 0.000 | 0.000 |
0.000 0.000 | 0.000 |
0.000 0.000 | 0.000 |
0.000 0.000 | 0.023 |
0.000 0.000 | 0.000 |
0.000 0.000 | 0.000 |
| 7 spectra, SNIPYWAIK | 0.016 | 0.952 | 0.000 | 0.000 | 0.000 | 0.012 | 0.000 | 0.020 | ||
| 2 spectra, LTVFAR | 0.000 | 0.480 | 0.000 | 0.000 | 0.000 | 0.520 | 0.000 | 0.000 | ||
| 1 spectrum, AVLGAVHGR | 0.023 | 0.288 | 0.086 | 0.000 | 0.000 | 0.603 | 0.000 | 0.000 | ||
| 3 spectra, IAAWLAQK | 0.104 | 0.896 | 0.000 | 0.000 | 0.000 | 0.000 | 0.000 | 0.000 | ||
| 1 spectrum, GAVTEVK | 0.000 | 0.898 | 0.000 | 0.000 | 0.000 | 0.000 | 0.102 | 0.000 | ||
| 1 spectrum, DWGEEGYYYLYR | 0.000 | 1.000 | 0.000 | 0.000 | 0.000 | 0.000 | 0.000 | 0.000 | ||
| 1 spectrum, GTLLSLSEQELLDCDK | 0.000 | 0.833 | 0.054 | 0.000 | 0.000 | 0.113 | 0.000 | 0.000 | ||
| 2 spectra, ACMGGLPSNAYTAIK | 0.000 | 0.827 | 0.000 | 0.000 | 0.000 | 0.000 | 0.173 | 0.000 |
| Plot | Mito | Lyso or Perox | ER | Golgi | PM | Cytosol | Nucleus | ||||||
| Expt B |
7 peptides |
21 spectra |
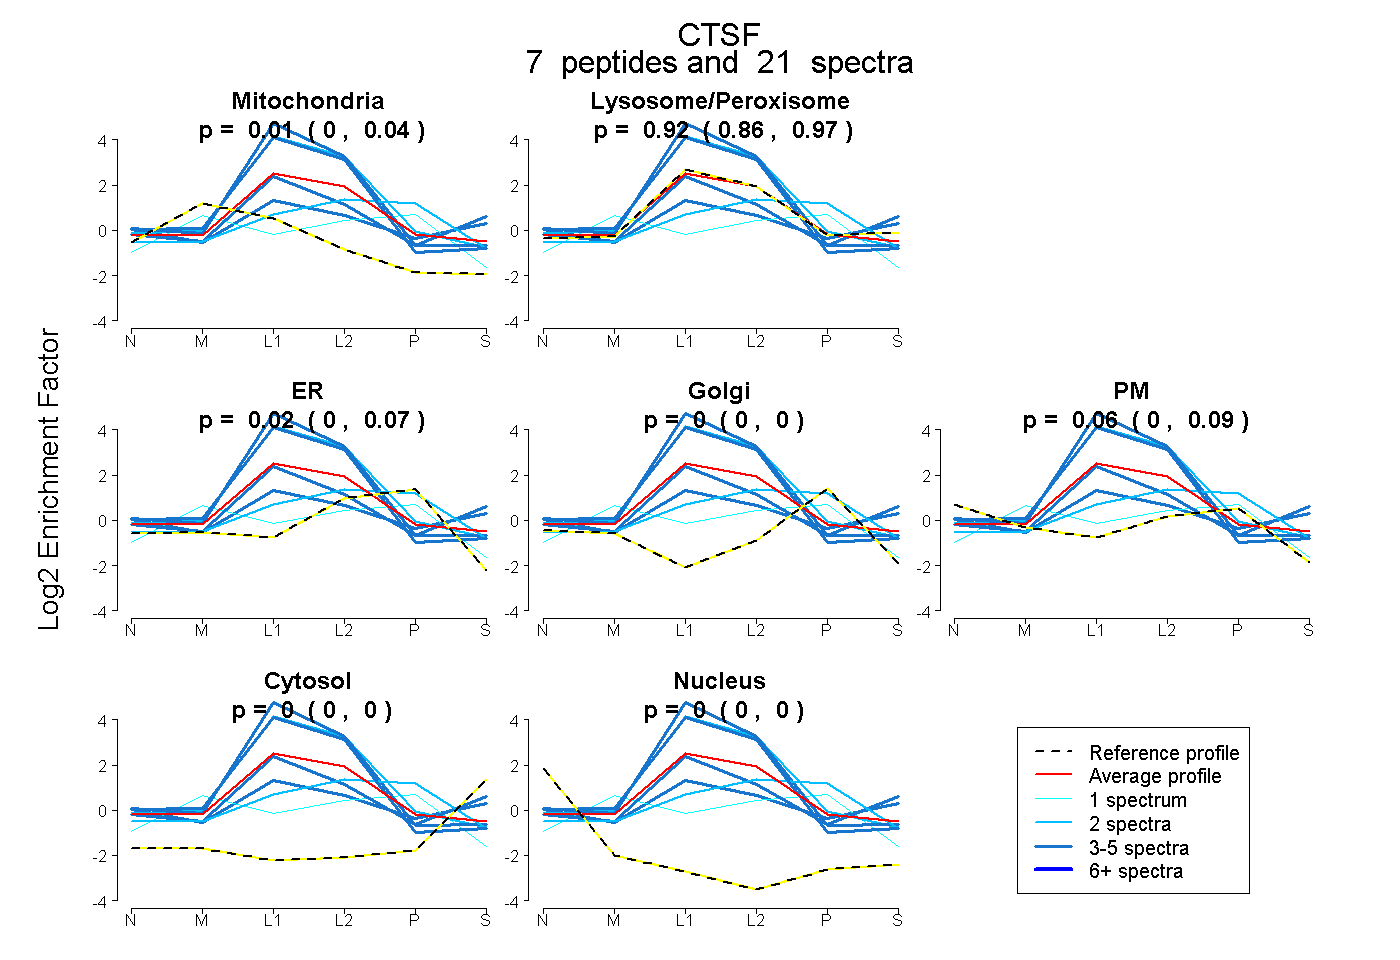 |
0.007 0.000 | 0.038 |
0.919 0.861 | 0.968 |
0.017 0.000 | 0.068 |
0.000 0.000 | 0.000 |
0.058 0.000 | 0.094 |
0.000 0.000 | 0.000 |
0.000 0.000 | 0.000 |
|||
| Plot | Lyso | Other | |||||||||||
| Expt C |
8 peptides |
139 spectra |
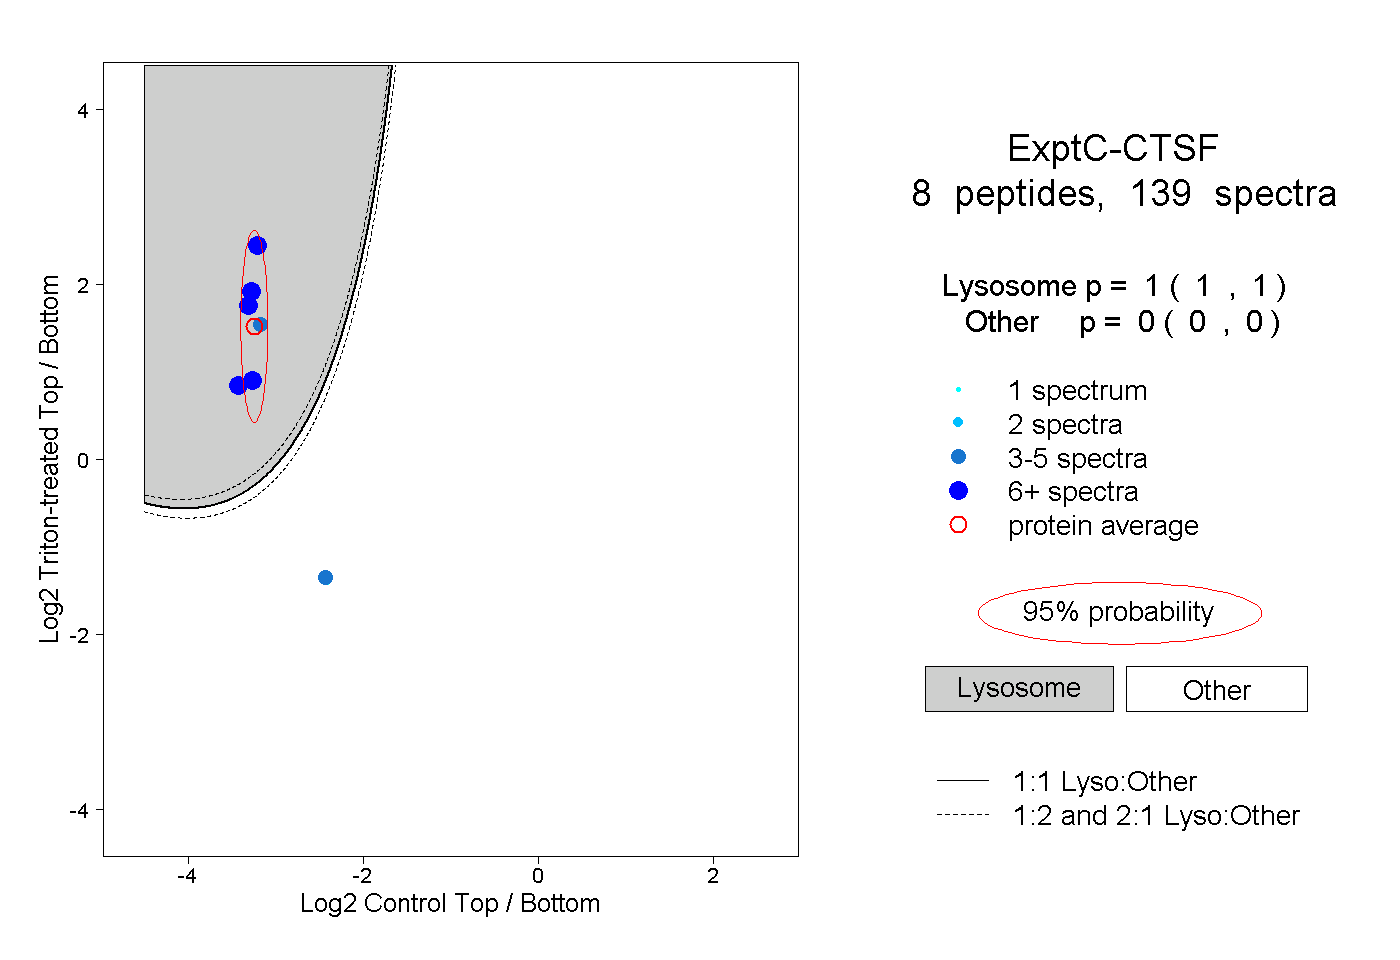 |
1.000 1.000 | 1.000 |
0.000 0.000 | 0.000 |
||||||||
| Plot | Lyso | Other | |||||||||||
| Expt D |
3 peptides |
4 spectra |
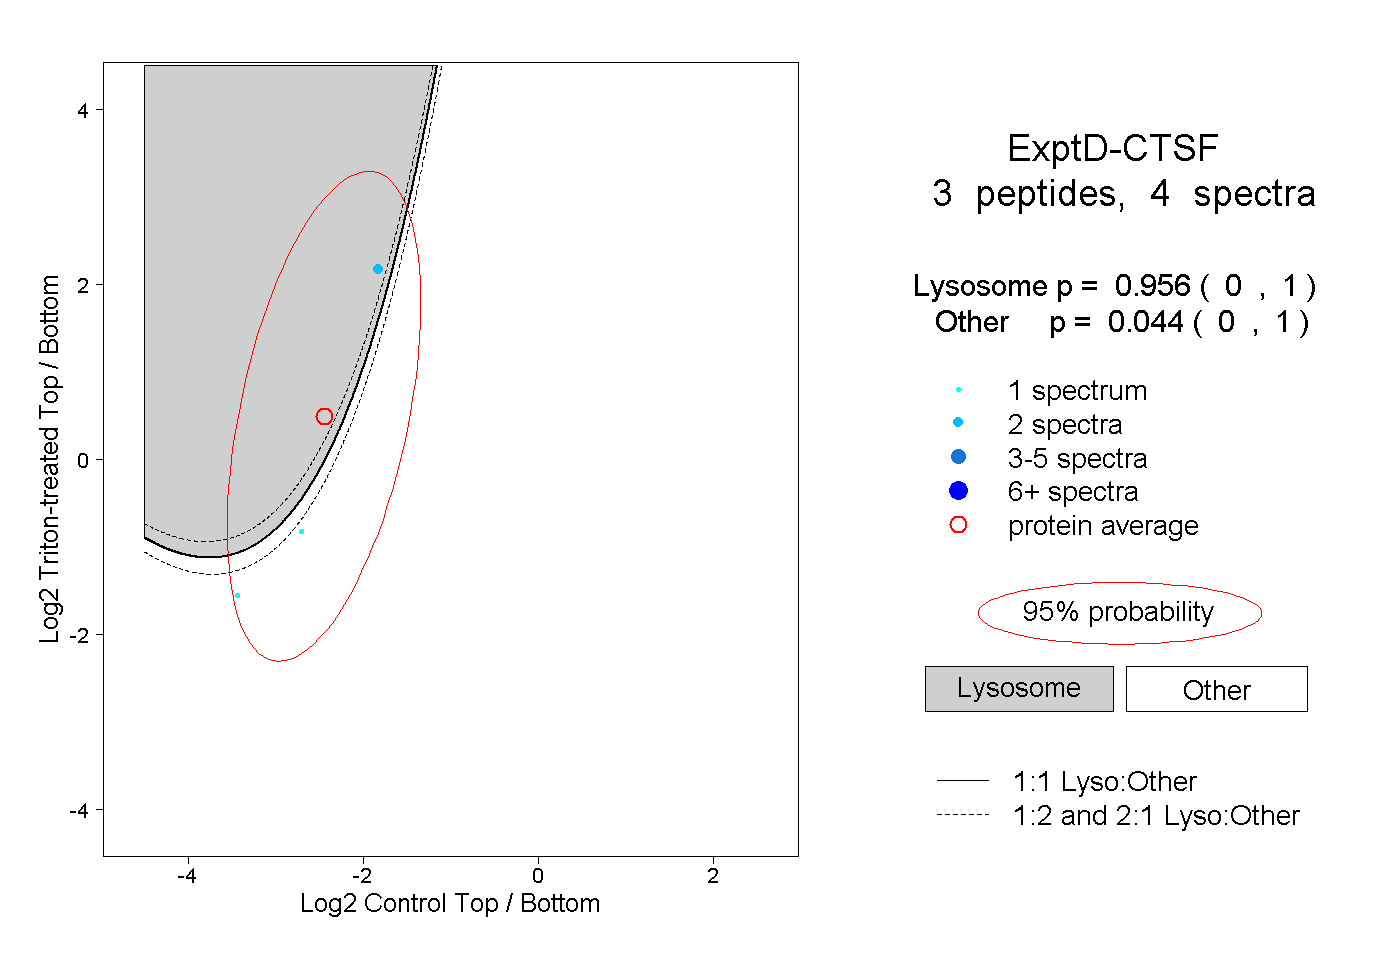 |
0.956 0.000 | 1.000 |
0.044 0.000 | 1.000 |