 2
2peptides
spectra
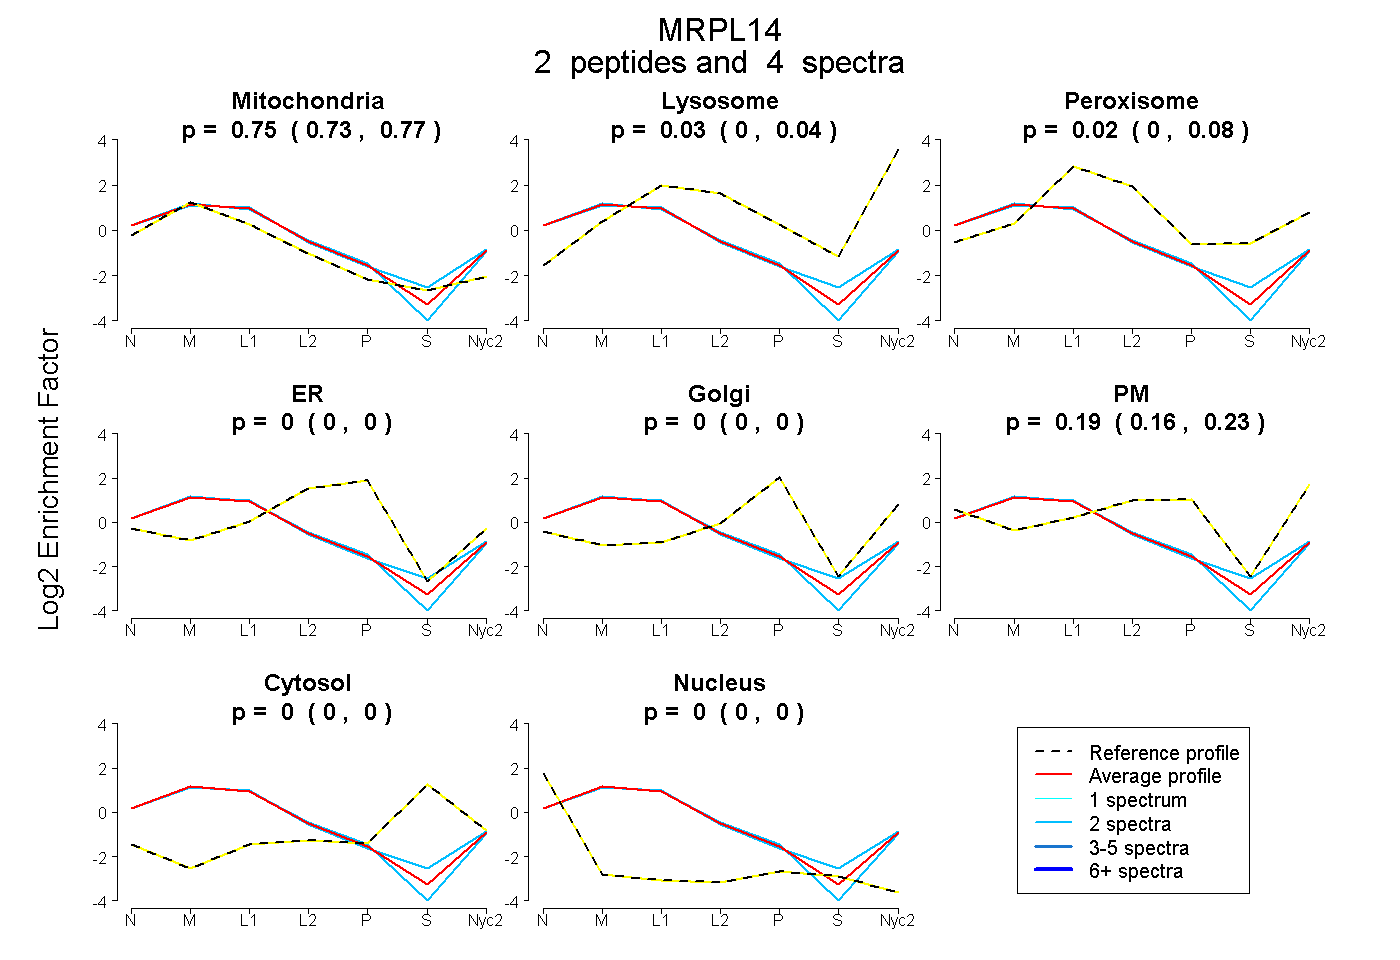
0.728 | 0.767
0.000 | 0.045
0.000 | 0.083
0.000 | 0.000
0.000 | 0.000
0.160 | 0.227
0.000 | 0.000
0.000 | 0.000
1peptide
spectrum
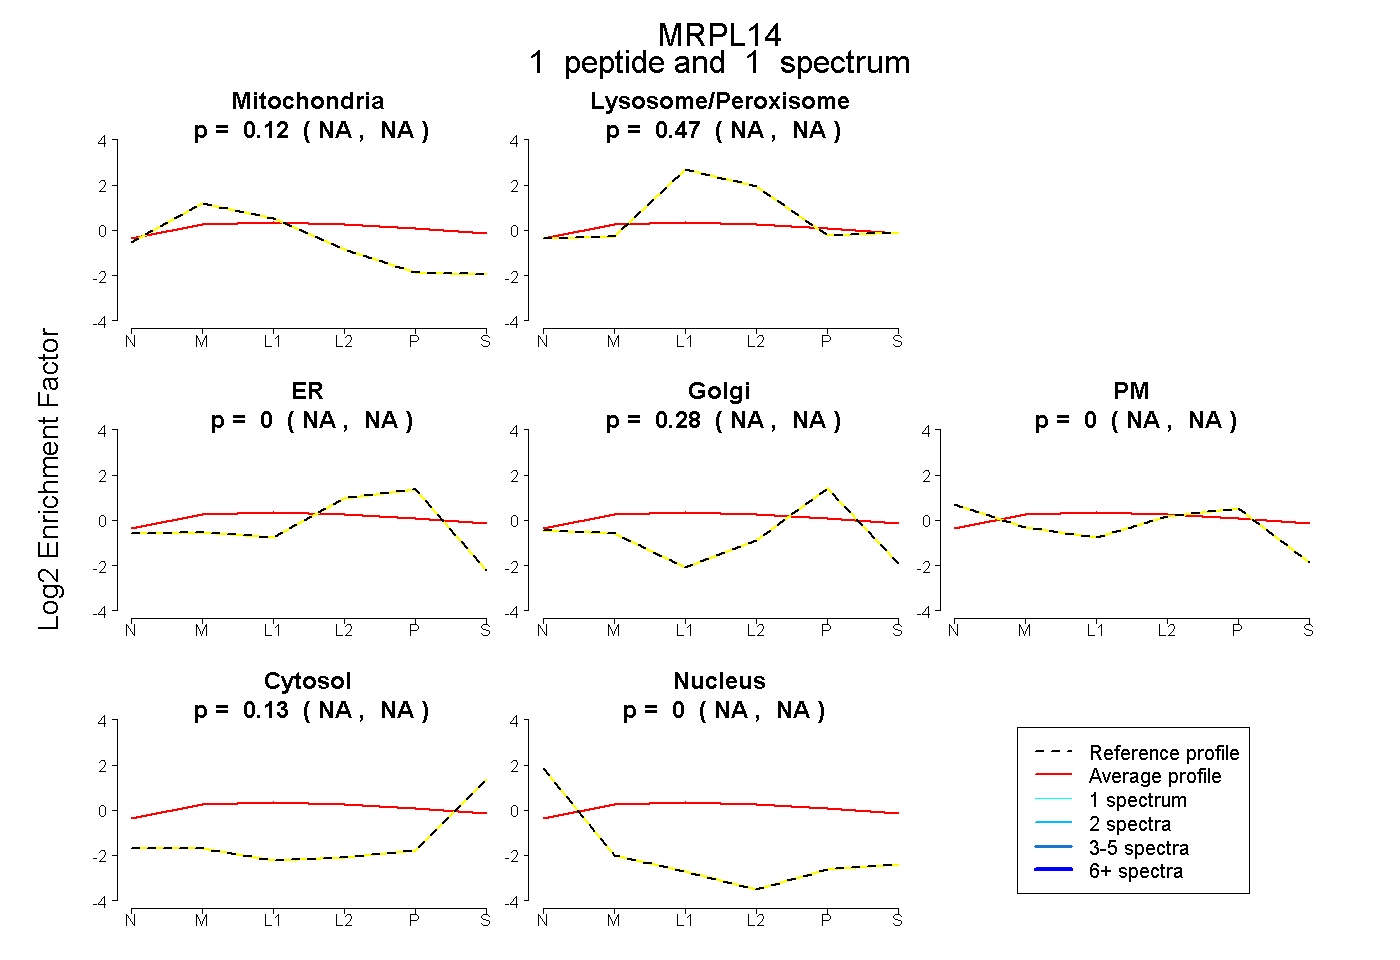
NA | NA
NA | NA
NA | NA
NA | NA
NA | NA
NA | NA
NA | NA
5peptides
spectra
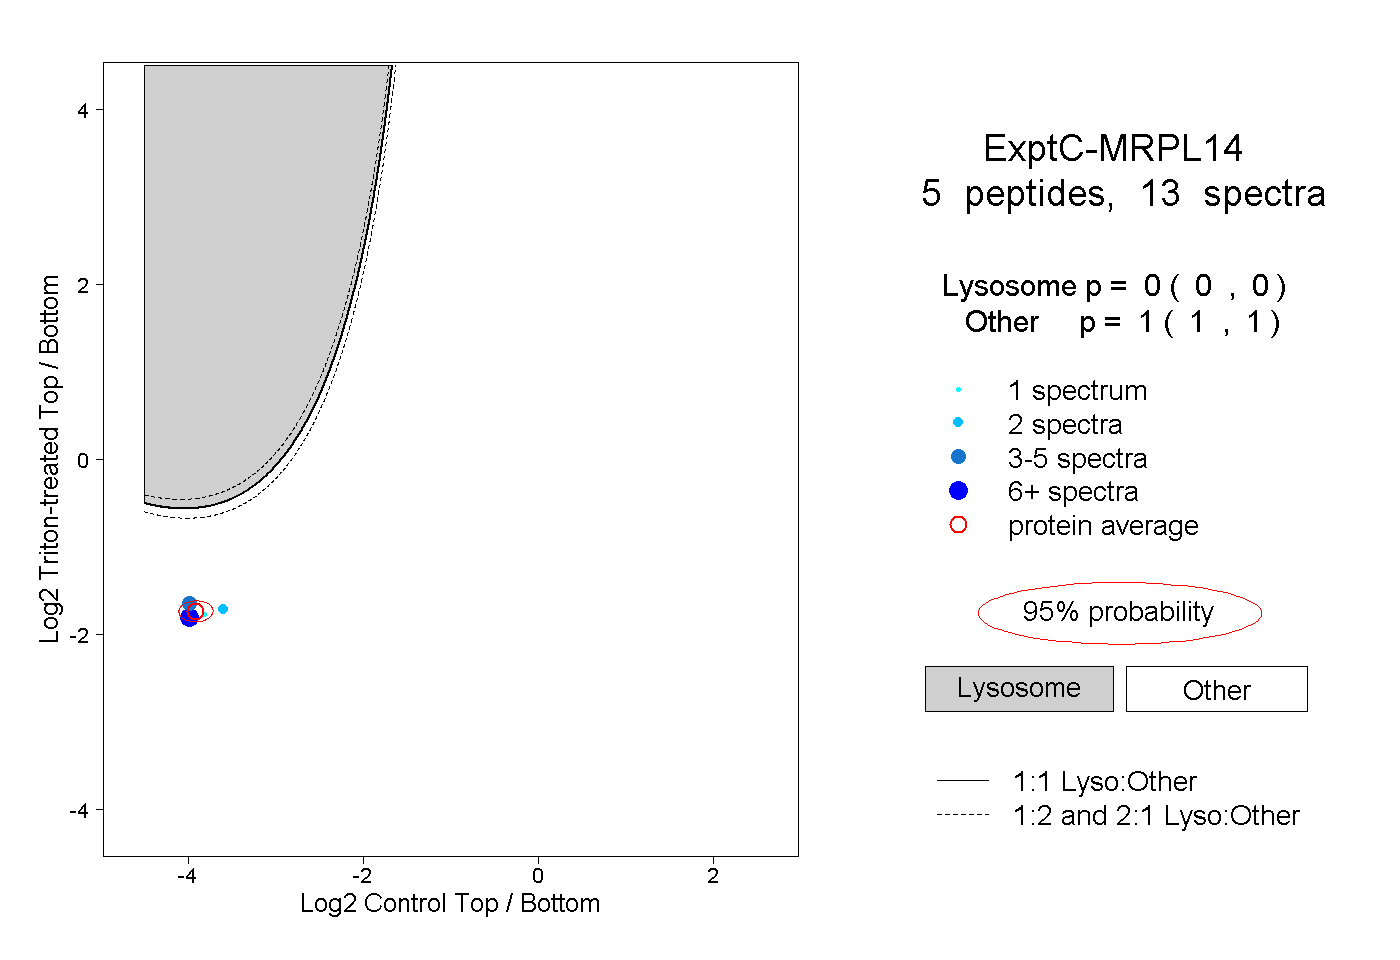
0.000 | 0.000
1.000 | 1.000
2peptides
spectra
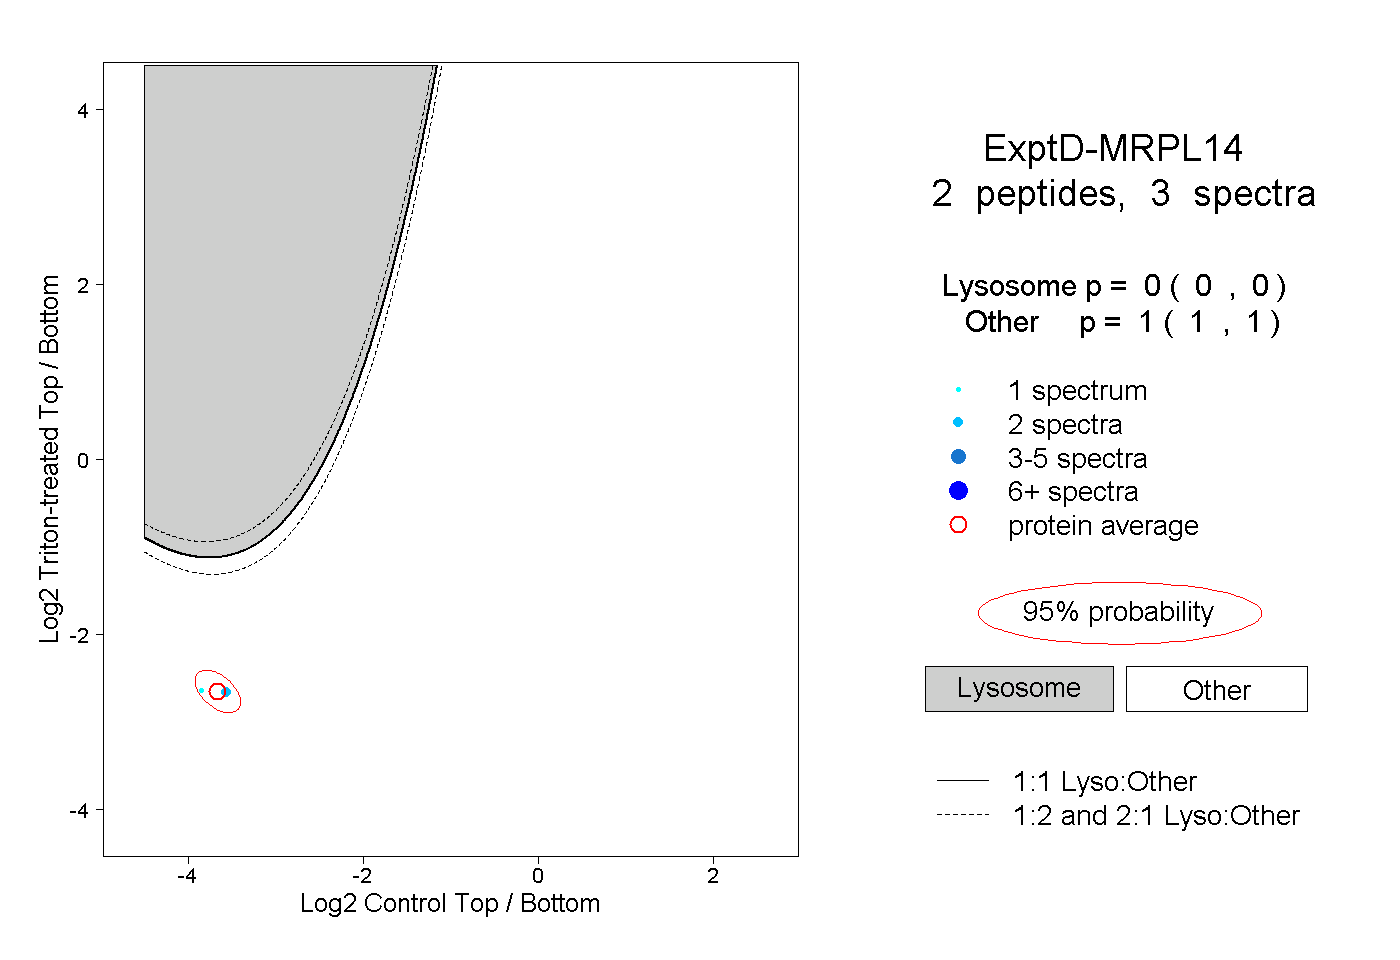
0.000 | 0.000
1.000 | 1.000