11
11peptides
spectra
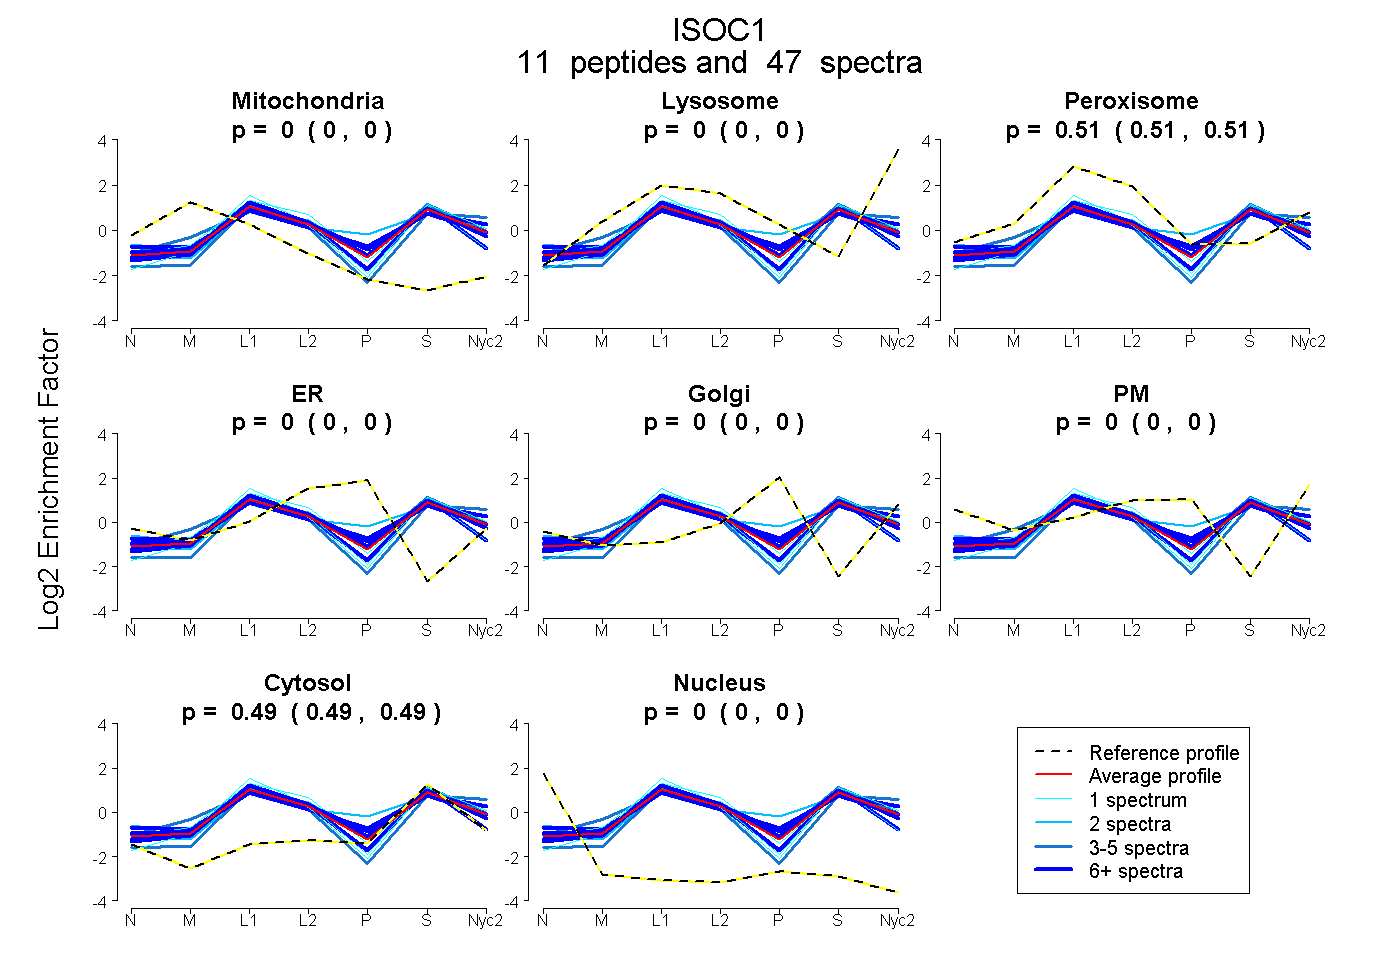
0.000 | 0.000
0.000 | 0.000
0.505 | 0.511
0.000 | 0.000
0.000 | 0.000
0.000 | 0.000
0.488 | 0.494
0.000 | 0.000
8peptides
spectra
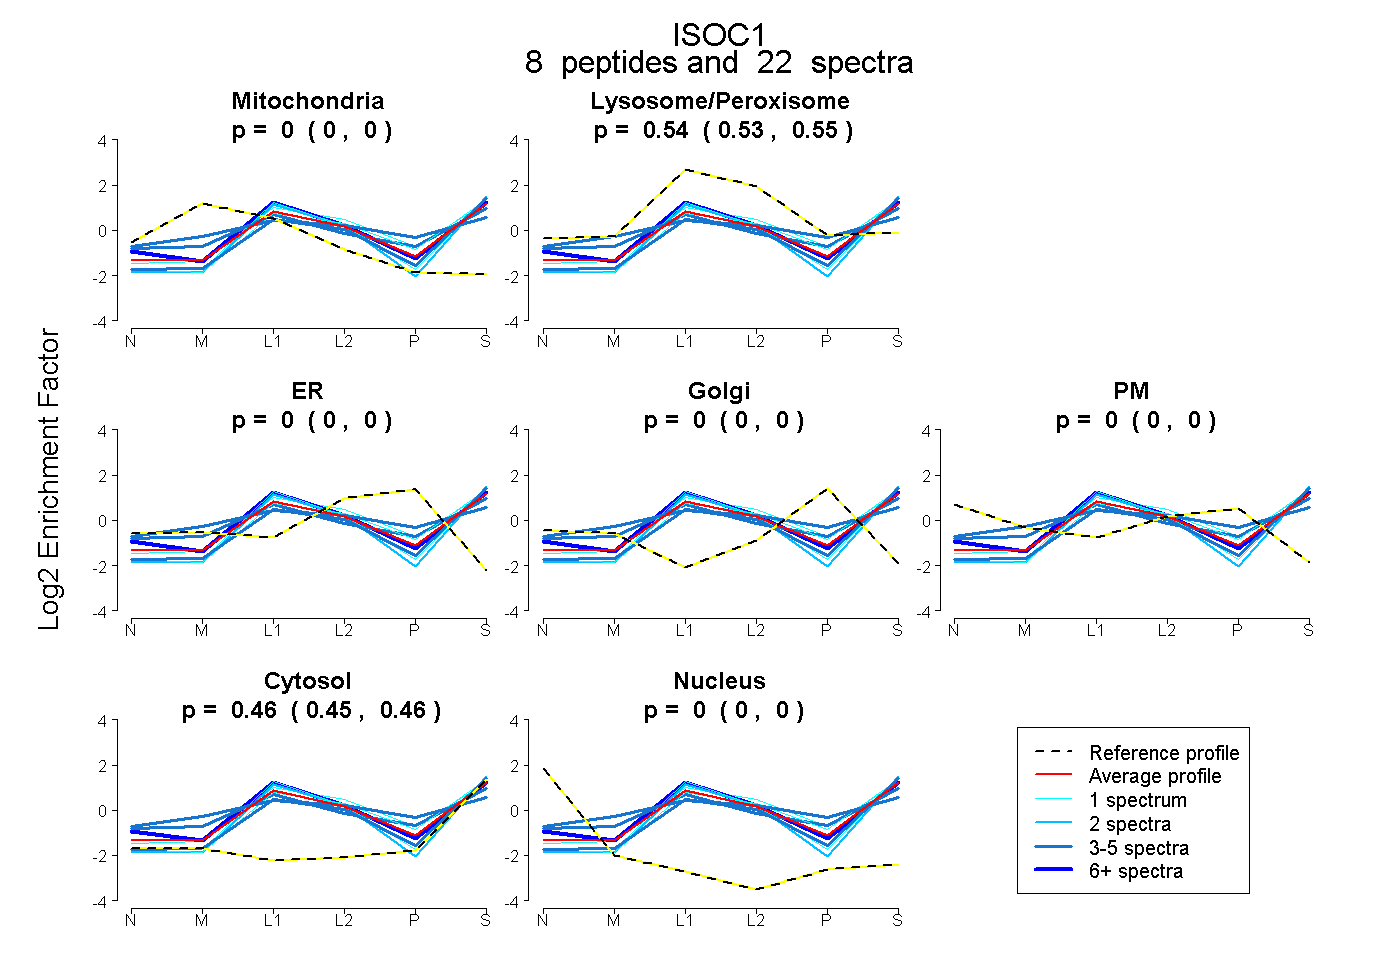
0.000 | 0.000
0.534 | 0.548
0.000 | 0.000
0.000 | 0.000
0.000 | 0.000
0.451 | 0.465
0.000 | 0.000