 11
11peptides
spectra
0.000 | 0.000
0.000 | 0.000
0.505 | 0.511
0.000 | 0.000
0.000 | 0.000
0.000 | 0.000
0.488 | 0.494
0.000 | 0.000
| Plot | Mito | Lyso | Perox | ER | Golgi | PM | Cytosol | Nucleus | |||||
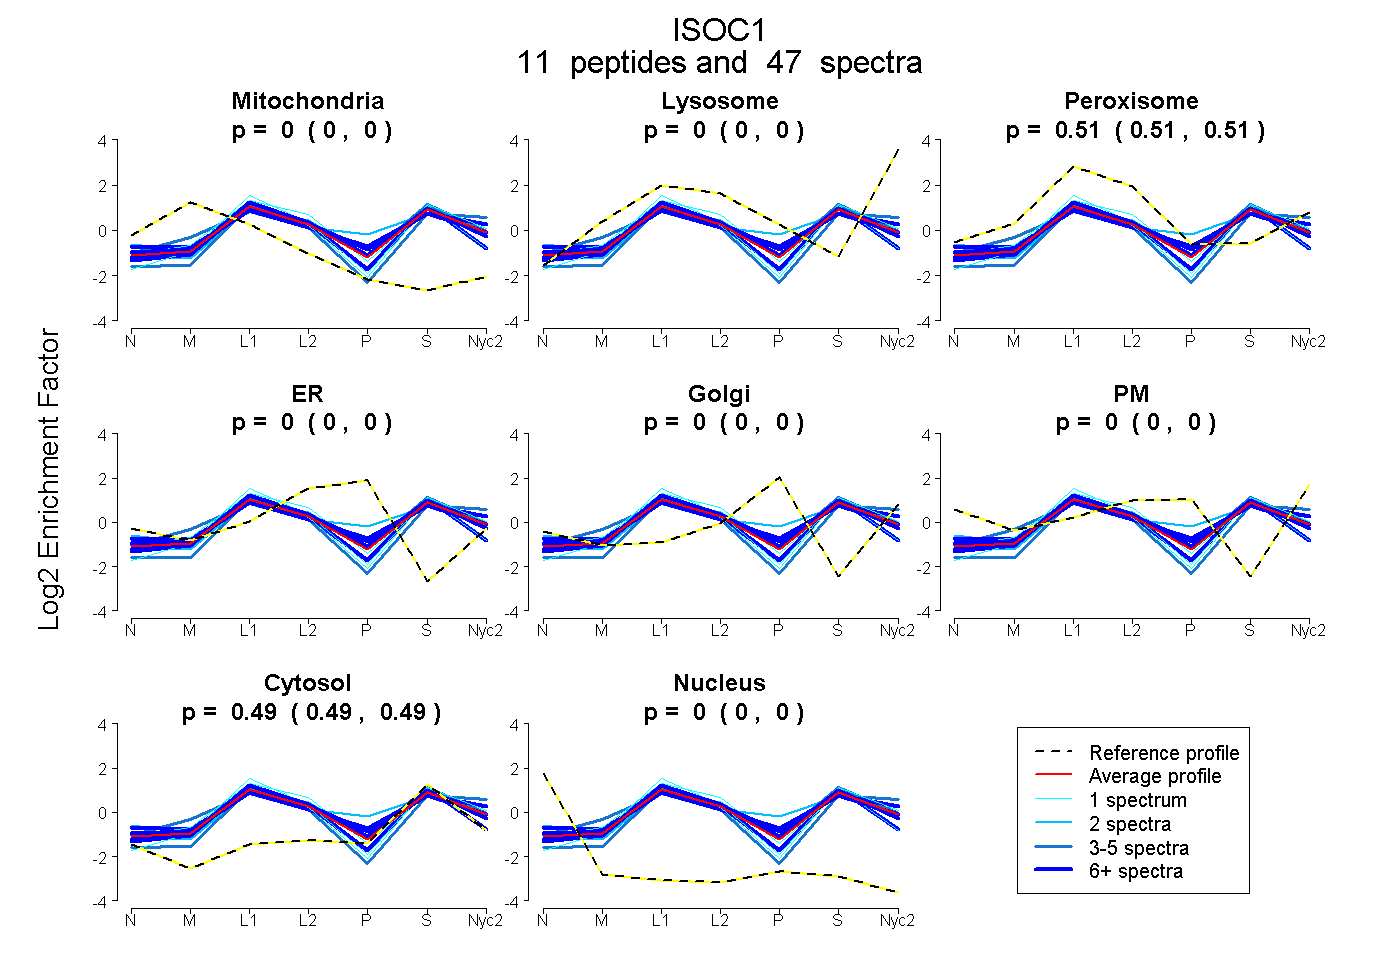
| Expt A |
11 peptides |
47 spectra |
|
0.000 0.000 | 0.000 |
0.000 0.000 | 0.000 |
0.509 0.505 | 0.511 |
0.000 0.000 | 0.000 |
0.000 0.000 | 0.000 |
0.000 0.000 | 0.000 |
0.491 0.488 | 0.494 |
0.000 0.000 | 0.000 |
| 9 spectra, GIEVHIVADATSSR | 0.000 | 0.043 | 0.487 | 0.000 | 0.000 | 0.000 | 0.470 | 0.000 | ||
| 1 spectrum, LIQGAR | 0.000 | 0.000 | 0.574 | 0.000 | 0.000 | 0.000 | 0.426 | 0.000 | ||
| 9 spectra, YFGDIISVGQR | 0.000 | 0.000 | 0.521 | 0.000 | 0.000 | 0.000 | 0.479 | 0.000 | ||
| 3 spectra, FLSLYGDQLDMHR | 0.057 | 0.050 | 0.452 | 0.000 | 0.000 | 0.000 | 0.441 | 0.000 | ||
| 6 spectra, MFALER | 0.000 | 0.000 | 0.519 | 0.000 | 0.000 | 0.000 | 0.481 | 0.000 | ||
| 3 spectra, GFAVSER | 0.000 | 0.000 | 0.450 | 0.000 | 0.000 | 0.000 | 0.550 | 0.000 | ||
| 2 spectra, EIQNLIK | 0.000 | 0.000 | 0.484 | 0.000 | 0.000 | 0.000 | 0.516 | 0.000 | ||
| 10 spectra, FRPAIK | 0.001 | 0.000 | 0.466 | 0.000 | 0.000 | 0.000 | 0.533 | 0.000 | ||
| 2 spectra, ASAPESGLLSK | 0.000 | 0.028 | 0.495 | 0.000 | 0.054 | 0.000 | 0.423 | 0.000 | ||
| 1 spectrum, GLGSTVQEIDLTGVK | 0.000 | 0.000 | 0.535 | 0.000 | 0.000 | 0.000 | 0.465 | 0.000 | ||
| 1 spectrum, ILGIPVIITEQYPK | 0.029 | 0.000 | 0.446 | 0.000 | 0.000 | 0.000 | 0.524 | 0.000 |
| Plot | Mito | Lyso or Perox | ER | Golgi | PM | Cytosol | Nucleus | ||||||
| Expt B |
8 peptides |
22 spectra |
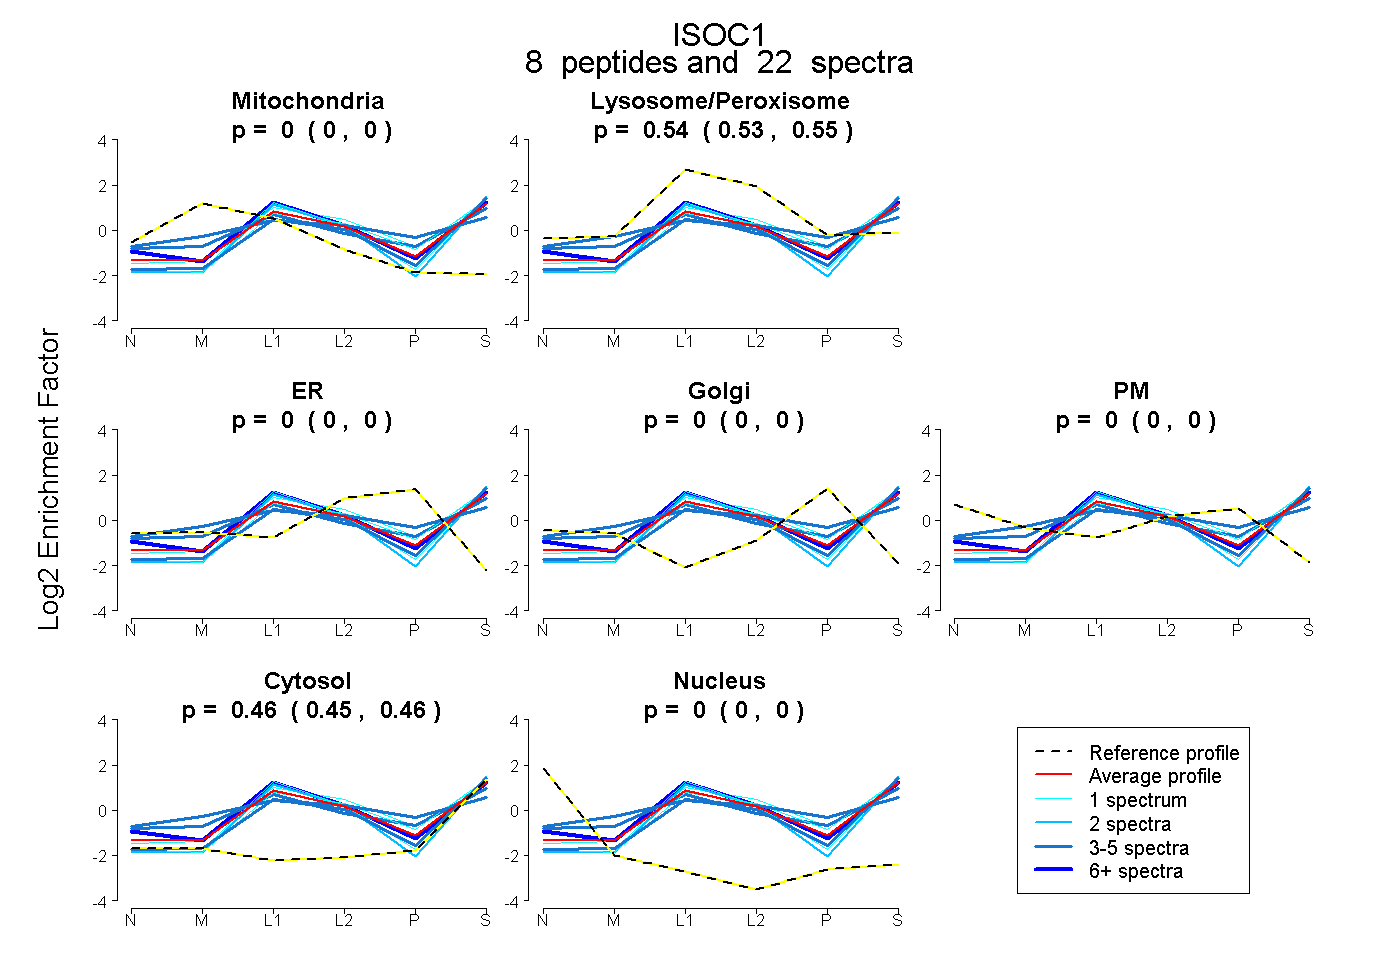 |
0.000 0.000 | 0.000 |
0.541 0.534 | 0.548 |
0.000 0.000 | 0.000 |
0.000 0.000 | 0.000 |
0.000 0.000 | 0.000 |
0.459 0.451 | 0.465 |
0.000 0.000 | 0.000 |
|||
| Plot | Lyso | Other | |||||||||||
| Expt C |
10 peptides |
121 spectra |
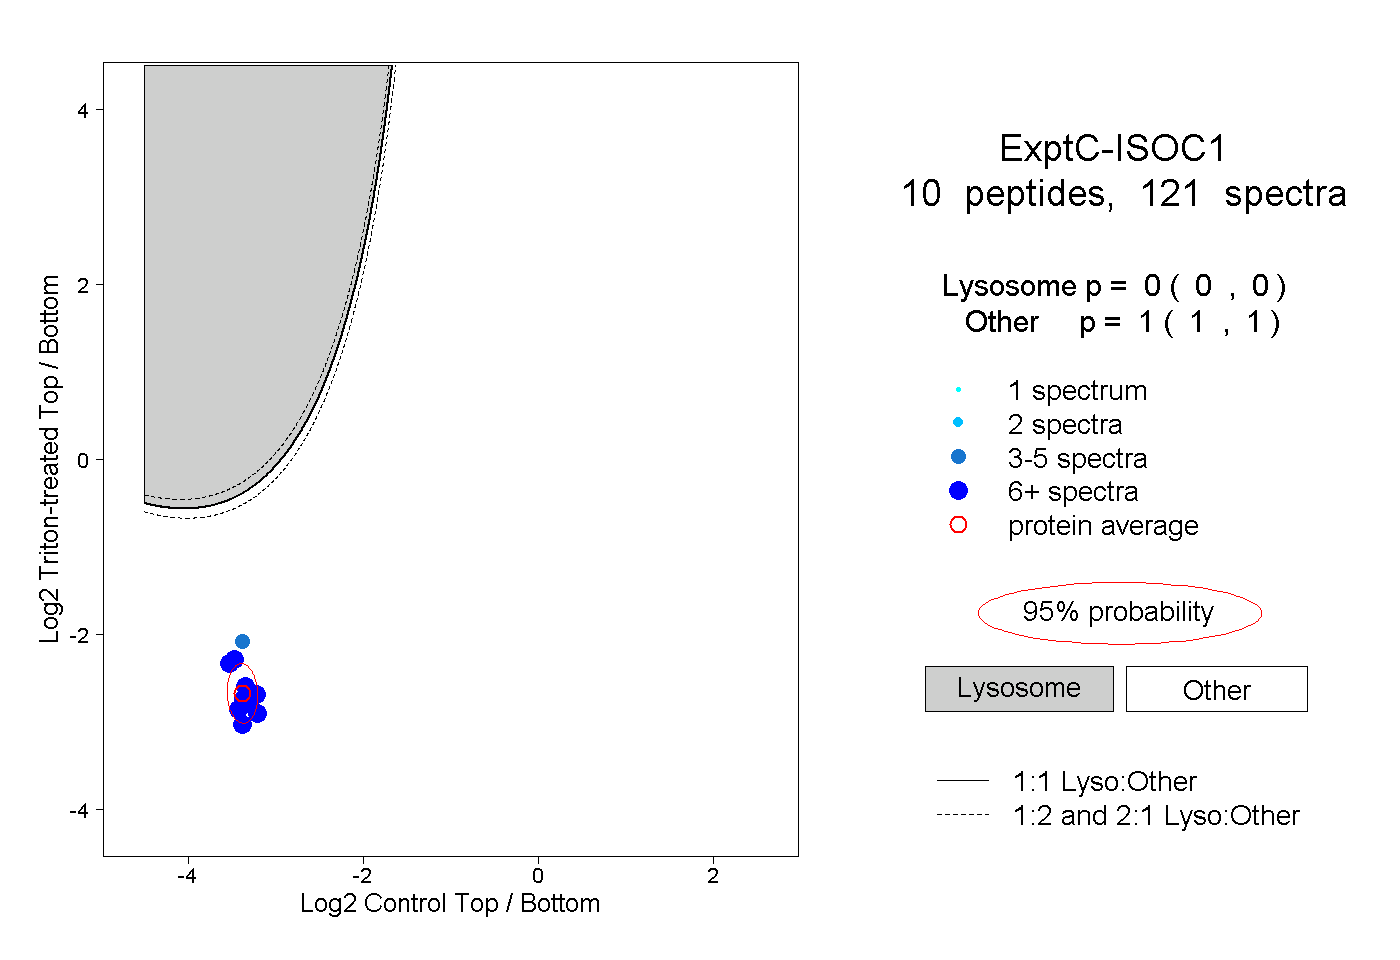 |
0.000 0.000 | 0.000 |
1.000 1.000 | 1.000 |
||||||||
| Plot | Lyso | Other | |||||||||||
| Expt D |
11 peptides |
25 spectra |
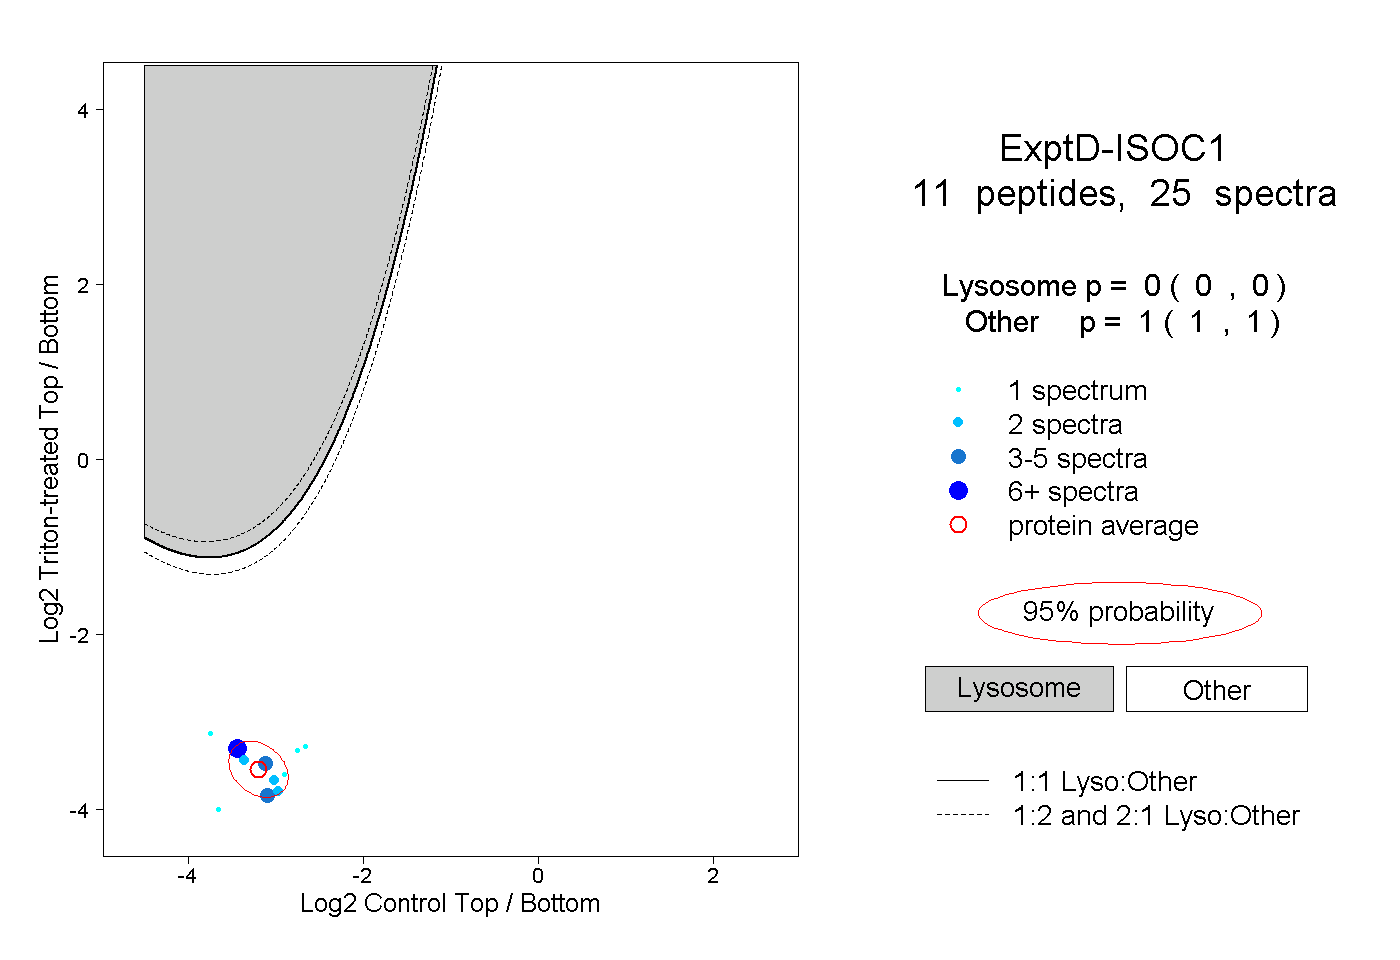 |
0.000 0.000 | 0.000 |
1.000 1.000 | 1.000 |