 4
4peptides
spectra
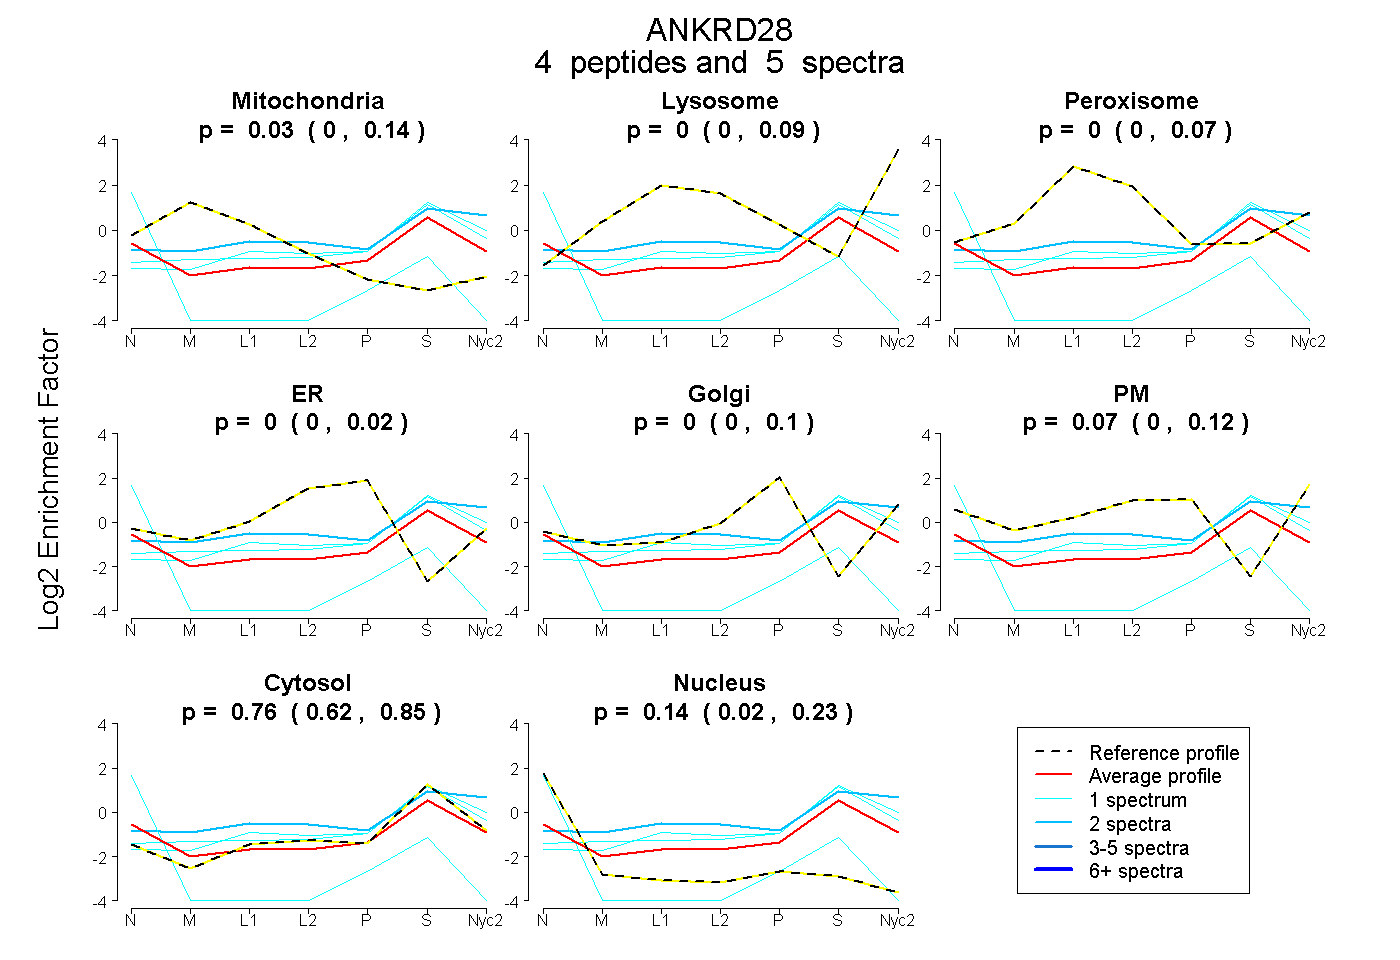
0.000 | 0.142
0.000 | 0.092
0.000 | 0.068
0.000 | 0.020
0.000 | 0.097
0.000 | 0.122
0.619 | 0.847
0.025 | 0.235
1peptide
spectrum
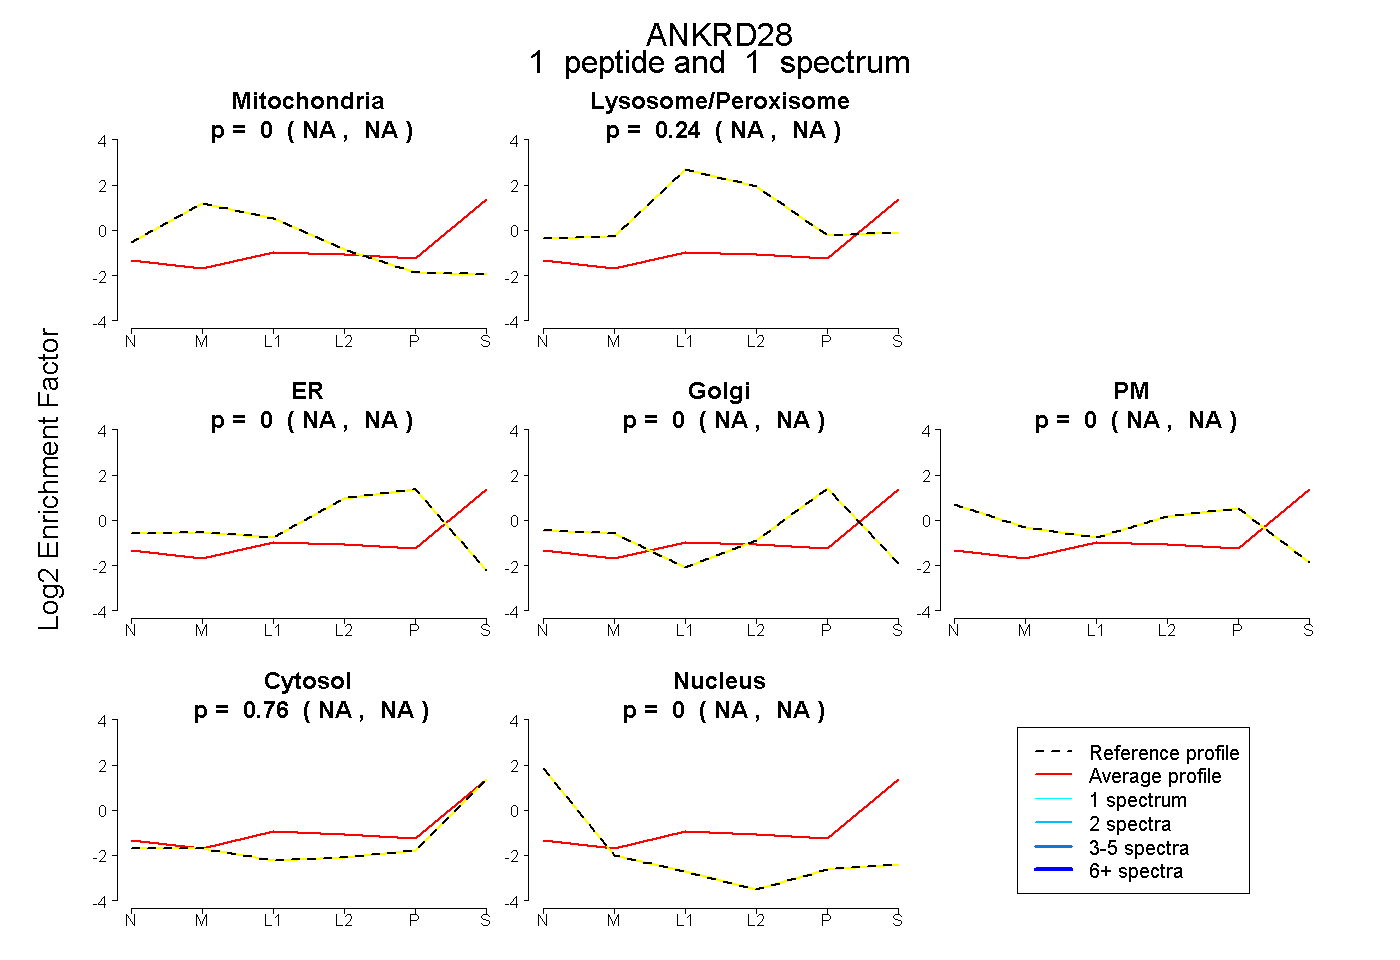
NA | NA
NA | NA
NA | NA
NA | NA
NA | NA
NA | NA
NA | NA
4peptides
spectra
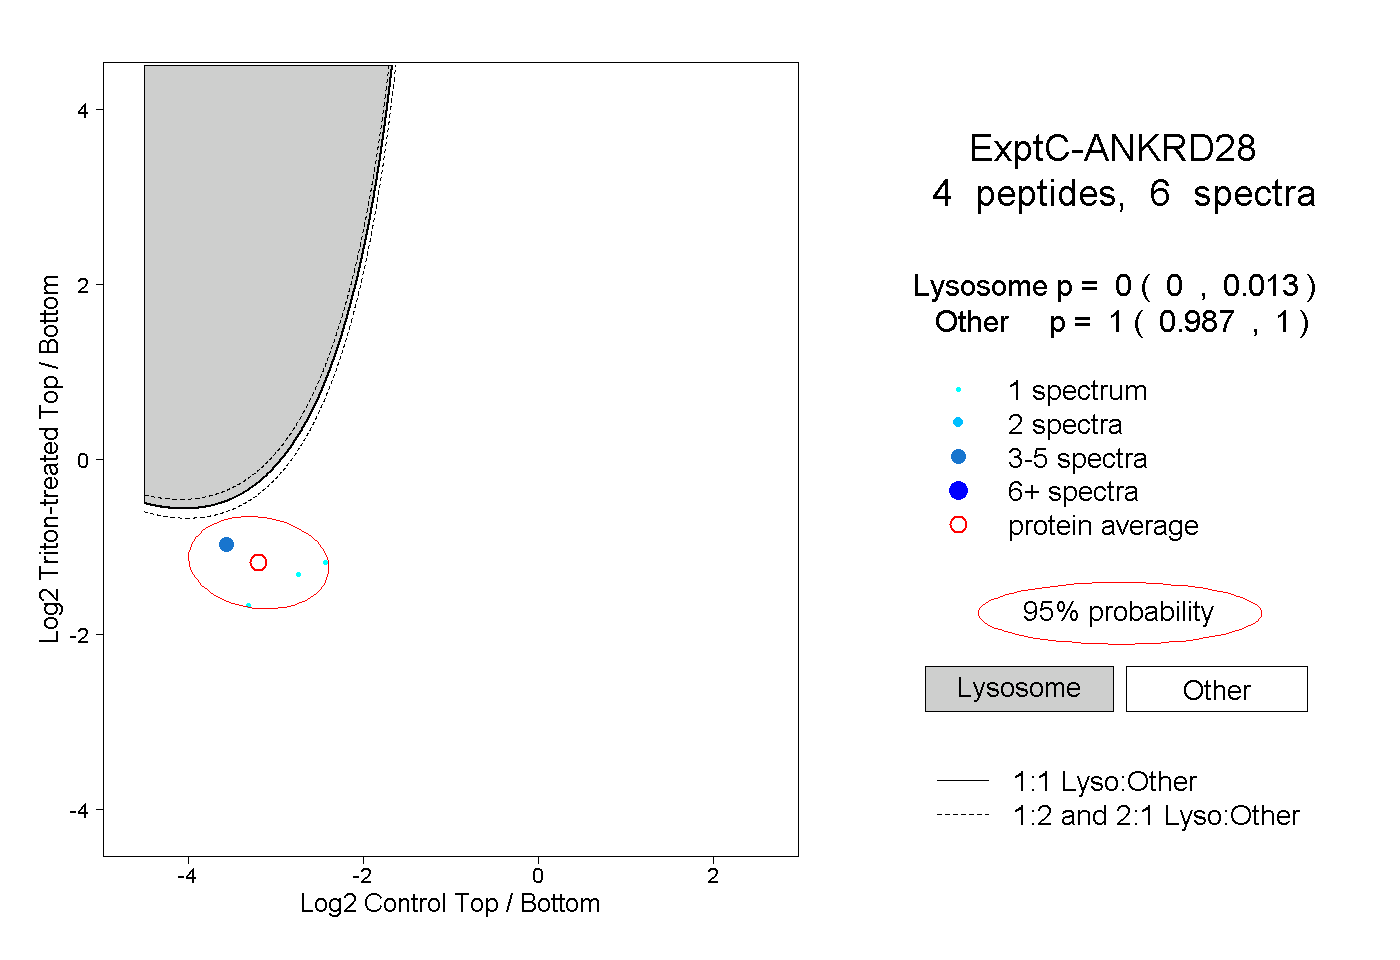
0.000 | 0.013
0.987 | 1.000