 4
4peptides
spectra
0.000 | 0.142
0.000 | 0.092
0.000 | 0.068
0.000 | 0.020
0.000 | 0.097
0.000 | 0.122
0.619 | 0.847
0.025 | 0.235
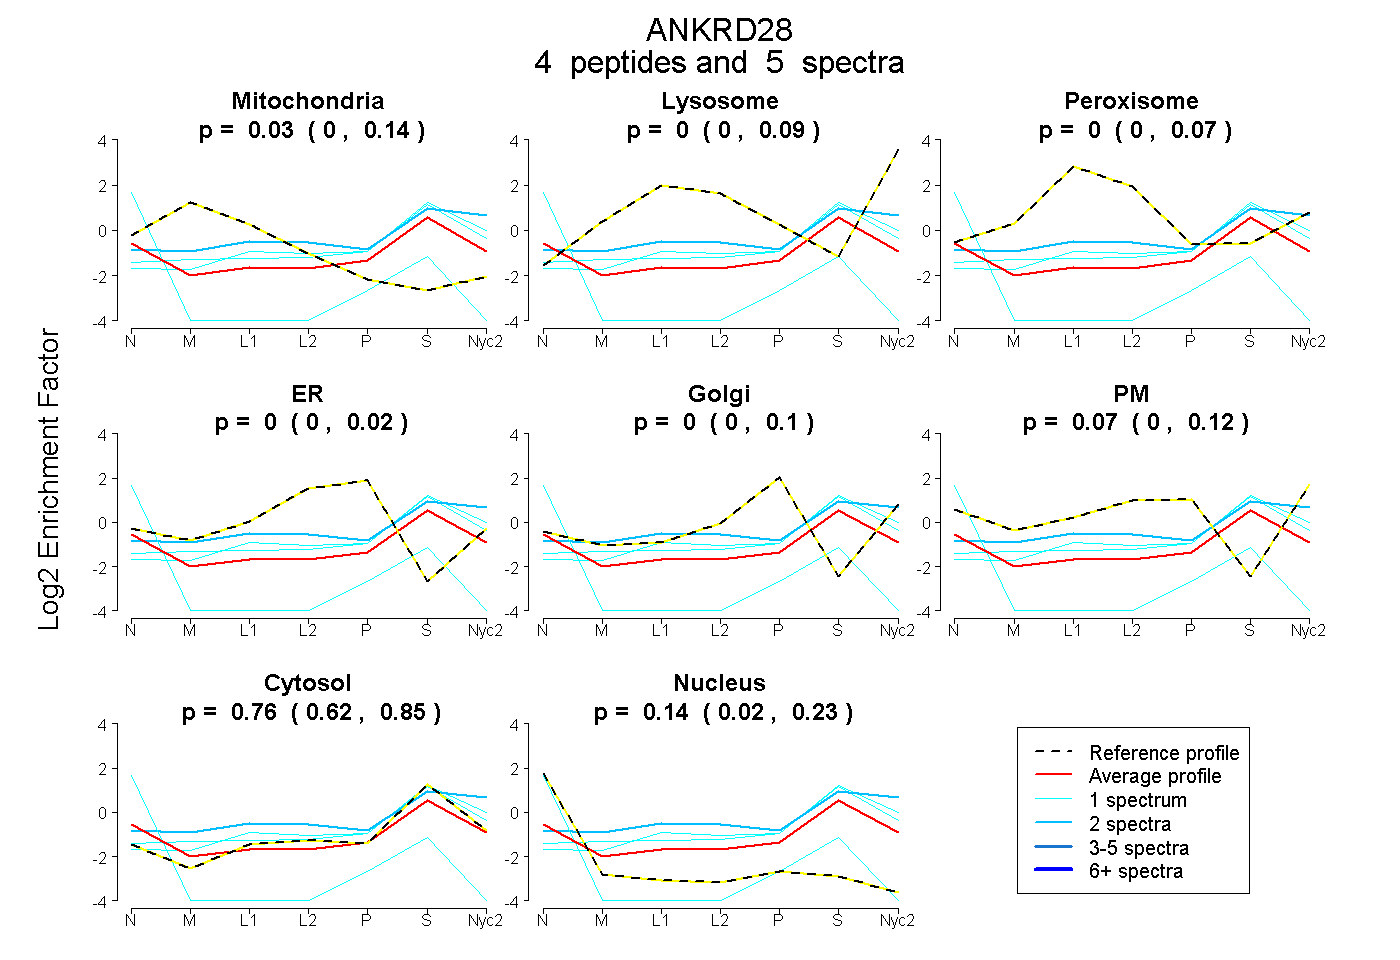
| Plot | Mito | Lyso | Perox | ER | Golgi | PM | Cytosol | Nucleus | |||||
| Expt A |
4 peptides |
5 spectra |
|
0.034 0.000 | 0.142 |
0.000 0.000 | 0.092 |
0.000 0.000 | 0.068 |
0.000 0.000 | 0.020 |
0.000 0.000 | 0.097 |
0.066 0.000 | 0.122 |
0.764 0.619 | 0.847 |
0.136 0.025 | 0.235 |
| 2 spectra, NLINATNAALQTPLHVAAR | 0.024 | 0.279 | 0.022 | 0.000 | 0.000 | 0.023 | 0.651 | 0.000 | ||
| 1 spectrum, LLVSHGAEVTCK | 0.064 | 0.104 | 0.000 | 0.000 | 0.008 | 0.000 | 0.824 | 0.000 | ||
| 1 spectrum, TPLDLAAFK | 0.000 | 0.000 | 0.000 | 0.000 | 0.000 | 0.000 | 0.073 | 0.927 | ||
| 1 spectrum, DYVIK | 0.000 | 0.164 | 0.000 | 0.000 | 0.000 | 0.000 | 0.836 | 0.000 |
| Plot | Mito | Lyso or Perox | ER | Golgi | PM | Cytosol | Nucleus | ||||||
| Expt B |
1 peptide |
1 spectrum |
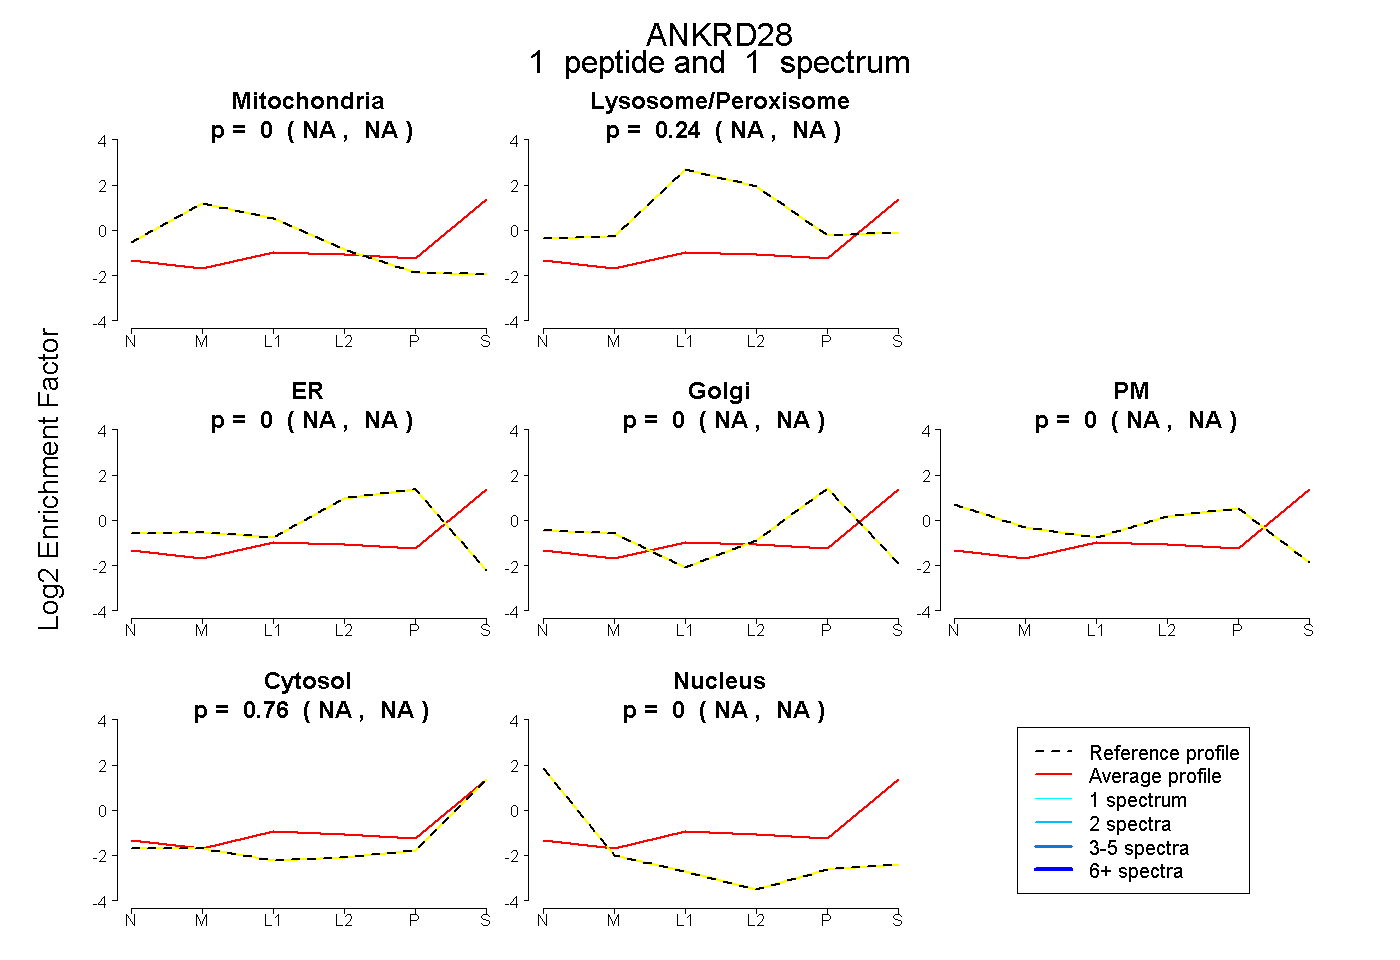 |
0.000 NA | NA |
0.238 NA | NA |
0.000 NA | NA |
0.000 NA | NA |
0.000 NA | NA |
0.762 NA | NA |
0.000 NA | NA |
|||
| Plot | Lyso | Other | |||||||||||
| Expt C |
4 peptides |
6 spectra |
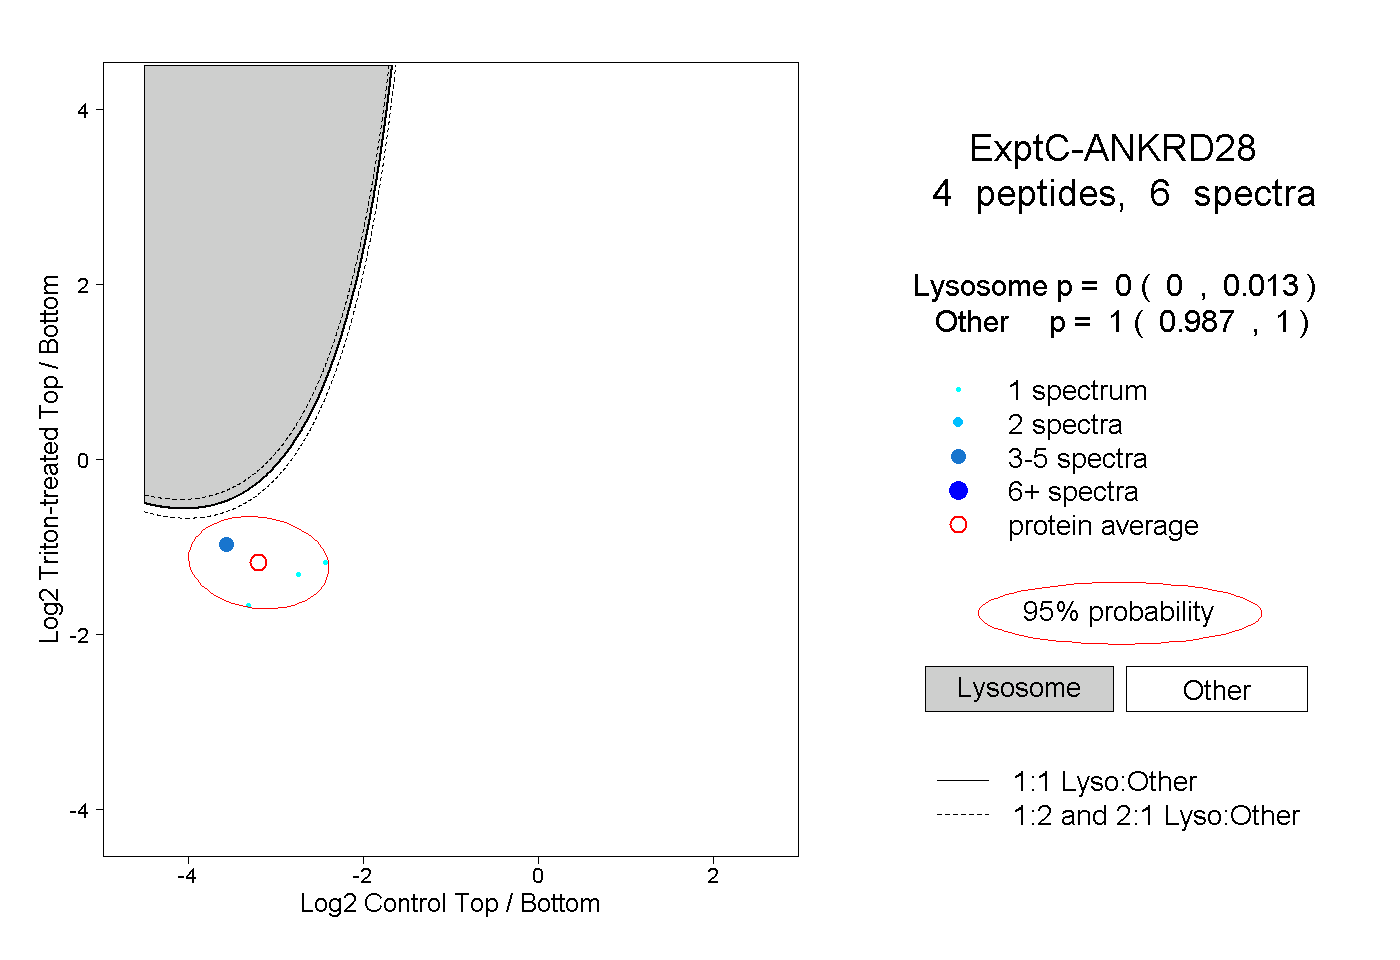 |
0.000 0.000 | 0.013 |
1.000 0.987 | 1.000 |