9
9peptides
spectra
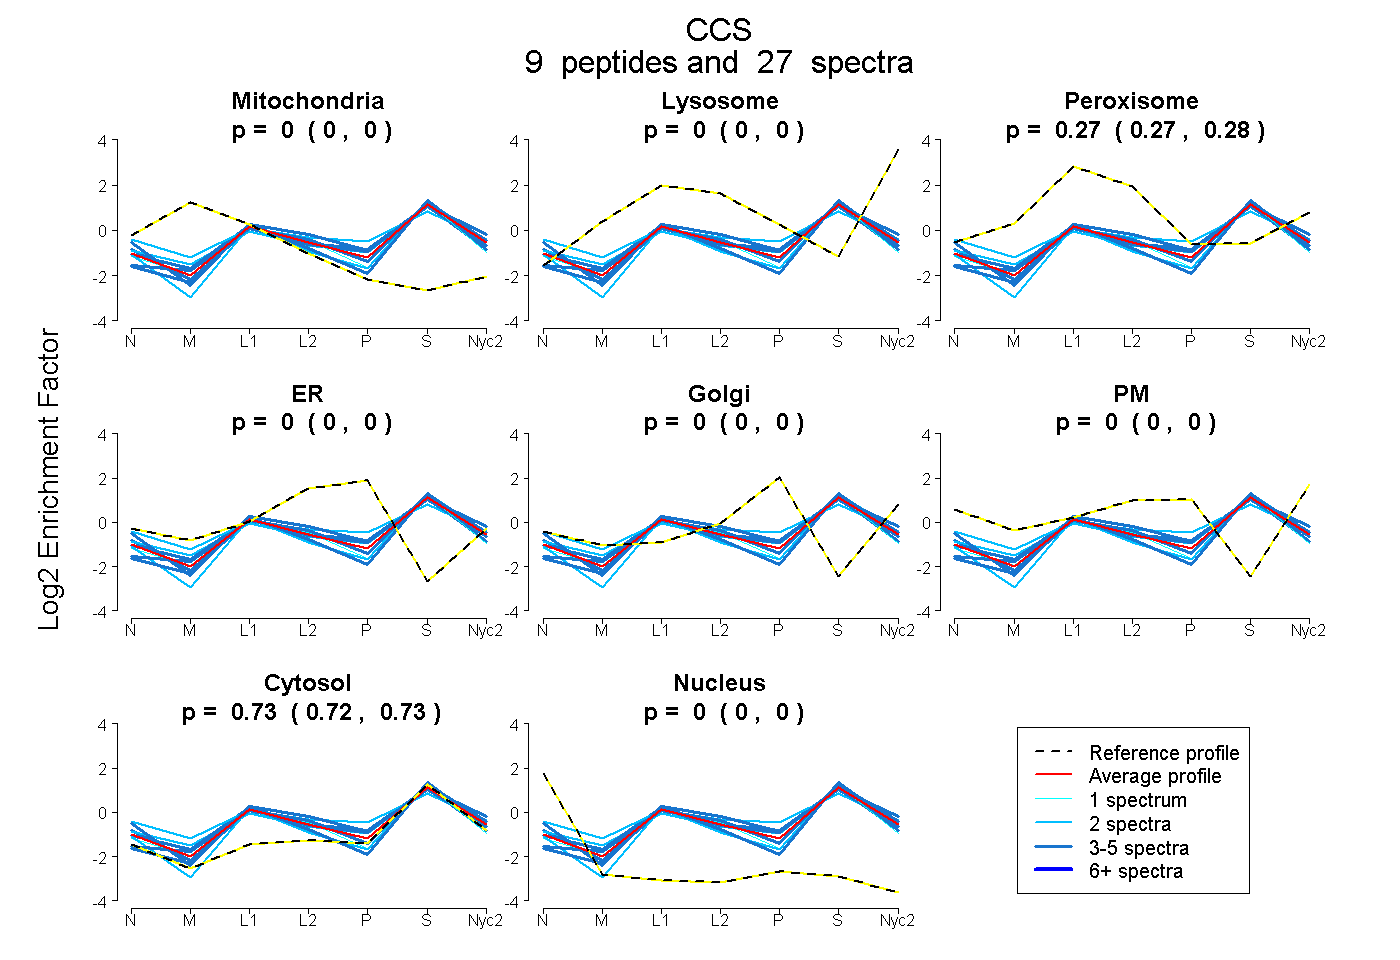
0.000 | 0.000
0.000 | 0.000
0.266 | 0.276
0.000 | 0.000
0.000 | 0.000
0.000 | 0.000
0.724 | 0.733
0.000 | 0.000
3peptides
spectra
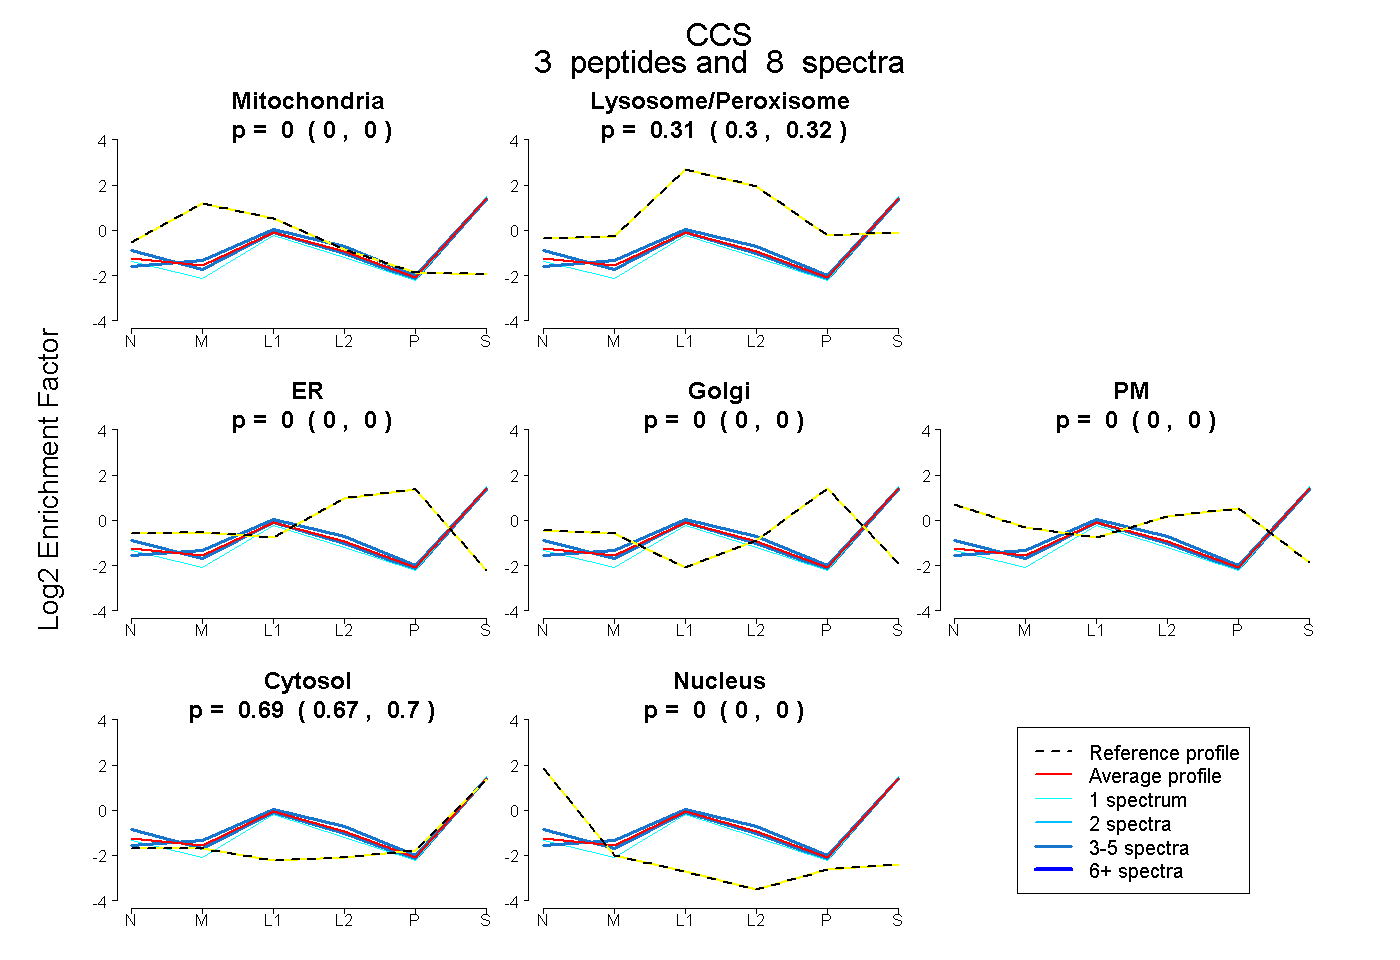
0.000 | 0.000
0.303 | 0.324
0.000 | 0.000
0.000 | 0.000
0.000 | 0.000
0.674 | 0.695
0.000 | 0.000
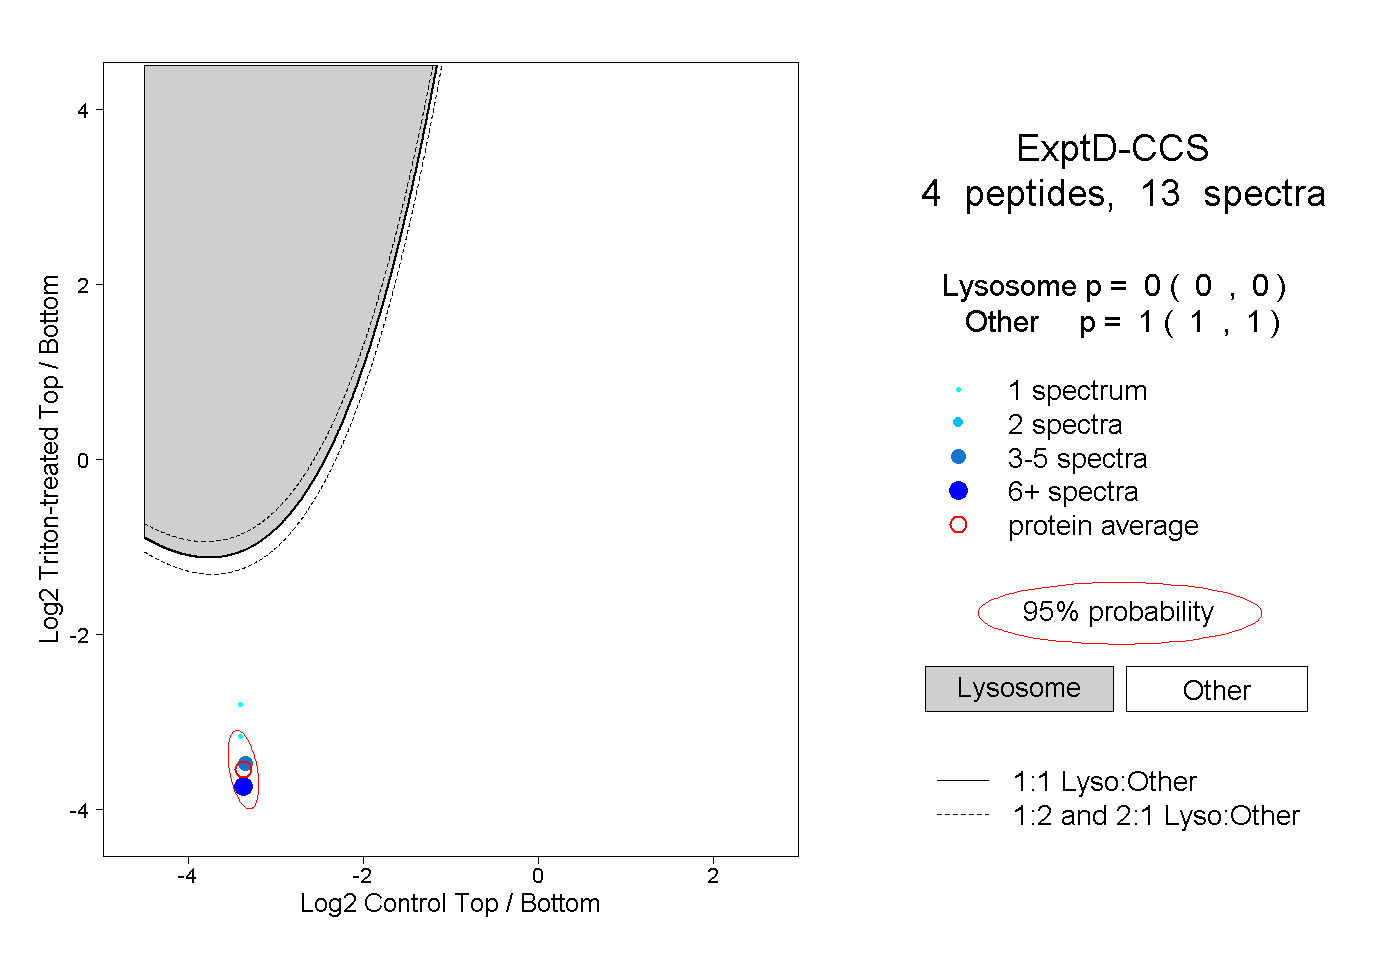
11peptides
spectra
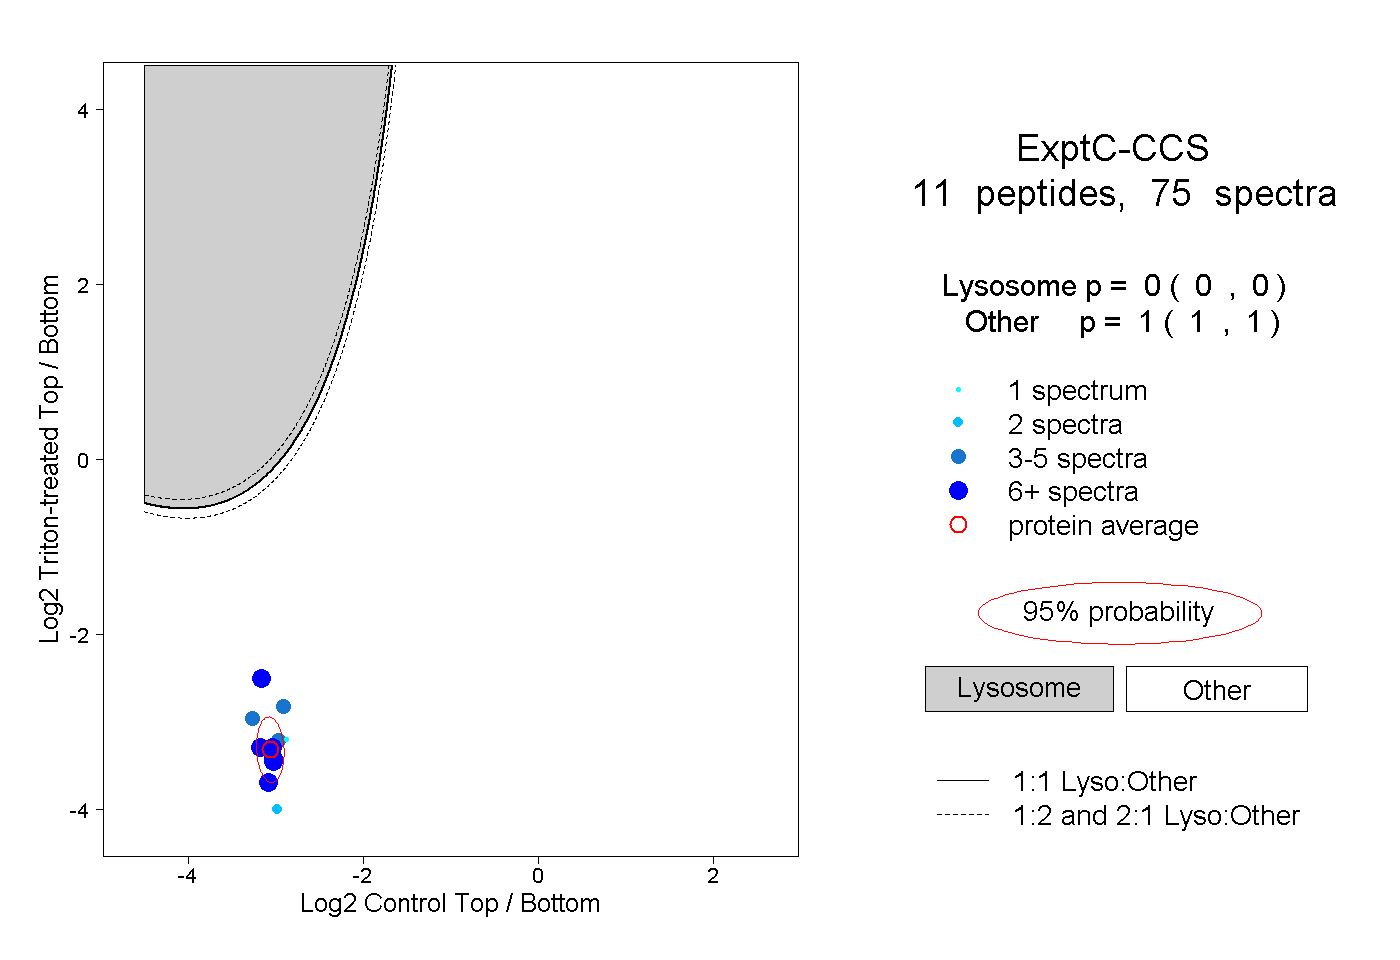
0.000 | 0.000
1.000 | 1.000