 9
9peptides
spectra
0.000 | 0.000
0.000 | 0.000
0.266 | 0.276
0.000 | 0.000
0.000 | 0.000
0.000 | 0.000
0.724 | 0.733
0.000 | 0.000
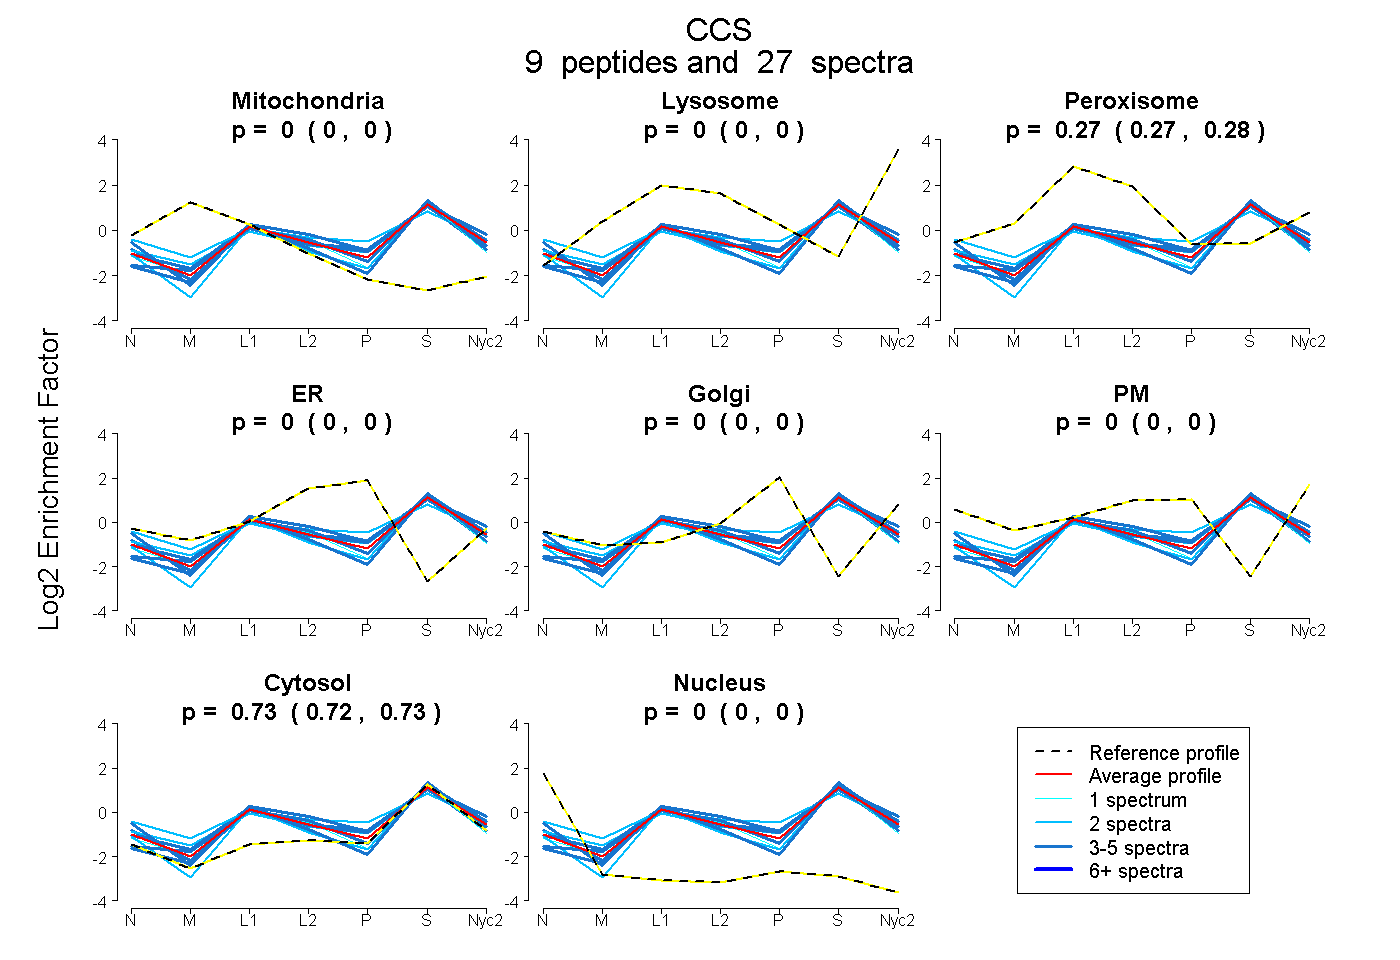
| Plot | Mito | Lyso | Perox | ER | Golgi | PM | Cytosol | Nucleus | |||||
| Expt A |
9 peptides |
27 spectra |
|
0.000 0.000 | 0.000 |
0.000 0.000 | 0.000 |
0.271 0.266 | 0.276 |
0.000 0.000 | 0.000 |
0.000 0.000 | 0.000 |
0.000 0.000 | 0.000 |
0.729 0.724 | 0.733 |
0.000 0.000 | 0.000 |
| 4 spectra, GRPIAGQGR | 0.000 | 0.000 | 0.299 | 0.000 | 0.000 | 0.000 | 0.694 | 0.008 | ||
| 5 spectra, SLVVDEGEDDLGR | 0.000 | 0.000 | 0.205 | 0.000 | 0.000 | 0.000 | 0.795 | 0.000 | ||
| 4 spectra, VWDVIGR | 0.000 | 0.000 | 0.275 | 0.000 | 0.000 | 0.000 | 0.725 | 0.000 | ||
| 4 spectra, DSAQPPAHL | 0.000 | 0.000 | 0.279 | 0.000 | 0.000 | 0.000 | 0.721 | 0.000 | ||
| 2 spectra, SAGLFQNPK | 0.000 | 0.000 | 0.172 | 0.000 | 0.000 | 0.000 | 0.828 | 0.000 | ||
| 3 spectra, GGHPLSK | 0.000 | 0.000 | 0.287 | 0.000 | 0.000 | 0.000 | 0.713 | 0.000 | ||
| 2 spectra, GMGSSQLK | 0.000 | 0.000 | 0.329 | 0.000 | 0.059 | 0.018 | 0.580 | 0.014 | ||
| 1 spectrum, LACGIIAR | 0.000 | 0.000 | 0.254 | 0.000 | 0.000 | 0.000 | 0.746 | 0.000 | ||
| 2 spectra, GDLGNVHAEASGR | 0.000 | 0.000 | 0.293 | 0.000 | 0.000 | 0.000 | 0.707 | 0.000 |
| Plot | Mito | Lyso or Perox | ER | Golgi | PM | Cytosol | Nucleus | ||||||
| Expt B |
3 peptides |
8 spectra |
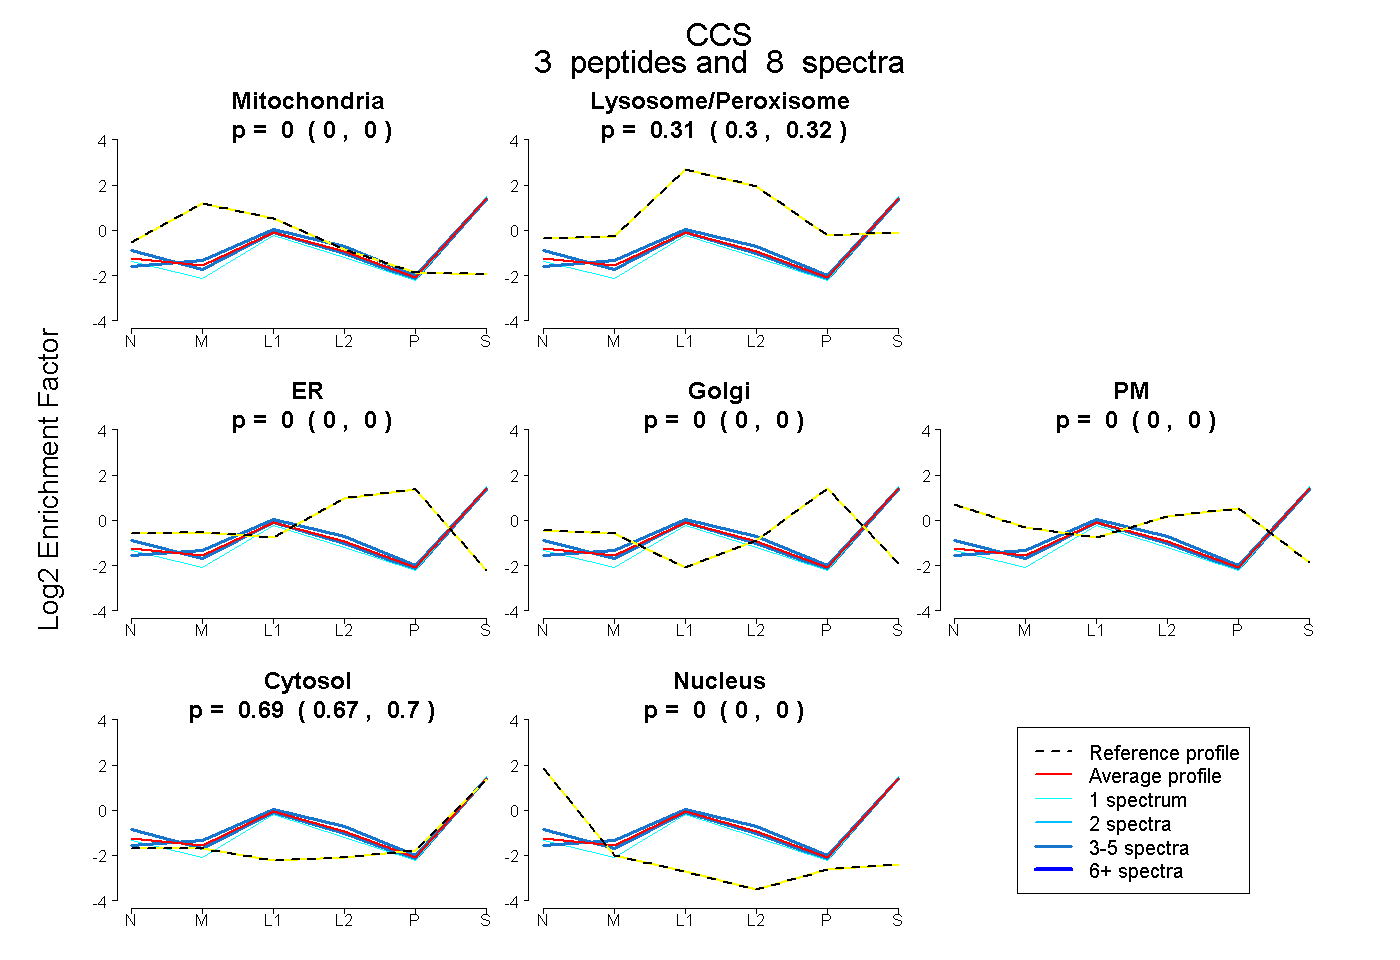 |
0.000 0.000 | 0.000 |
0.314 0.303 | 0.324 |
0.000 0.000 | 0.000 |
0.000 0.000 | 0.000 |
0.000 0.000 | 0.000 |
0.686 0.674 | 0.695 |
0.000 0.000 | 0.000 |
|||
| Plot | Lyso | Other | |||||||||||
| Expt C |
11 peptides |
75 spectra |
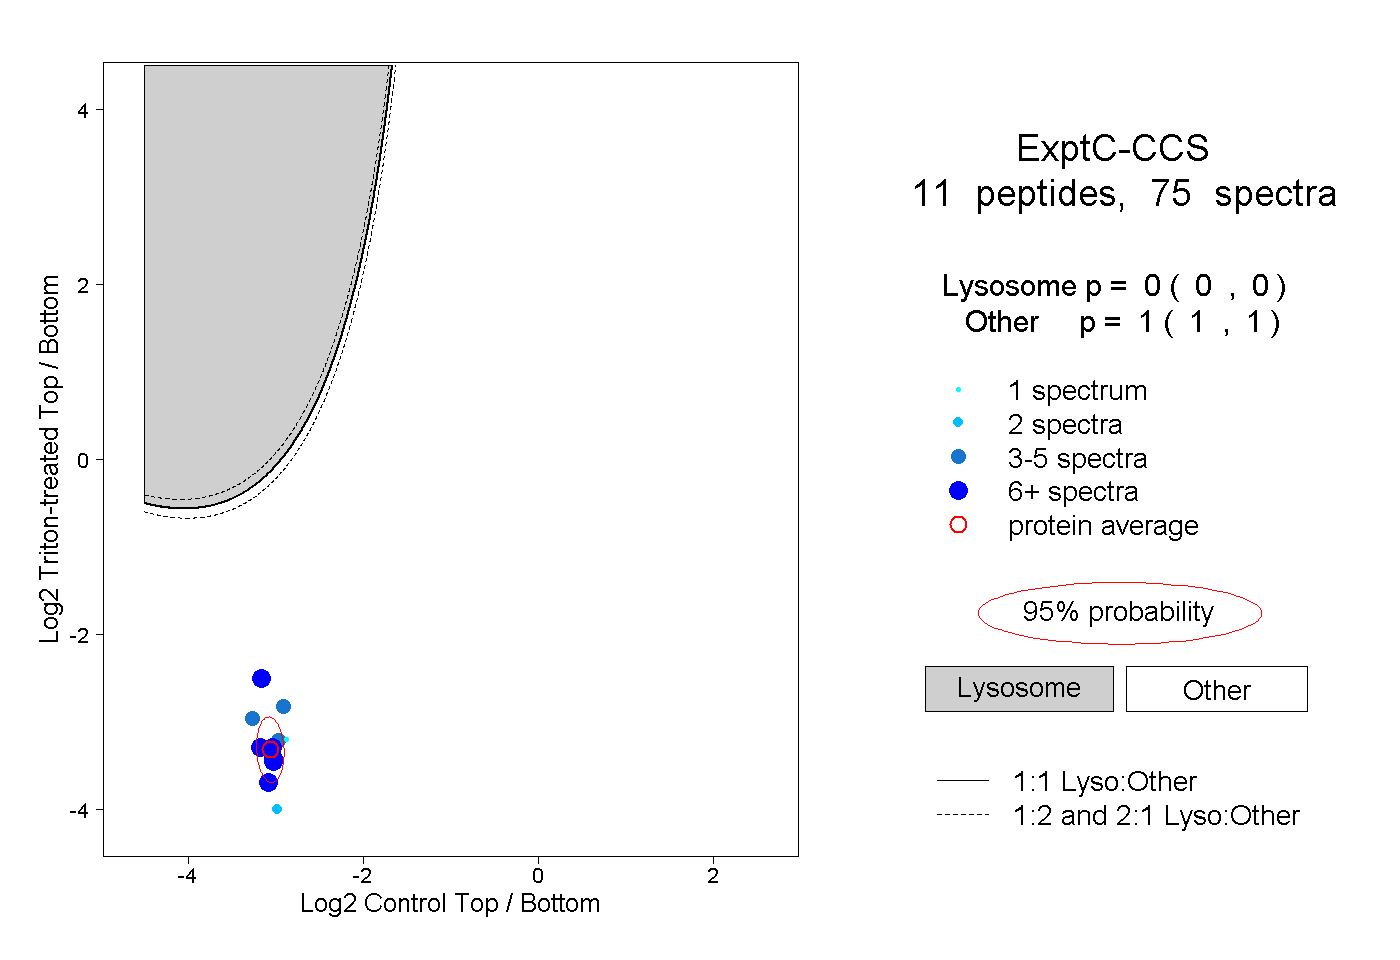 |
0.000 0.000 | 0.000 |
1.000 1.000 | 1.000 |
||||||||
| Plot | Lyso | Other | |||||||||||
| Expt D |
4 peptides |
13 spectra |
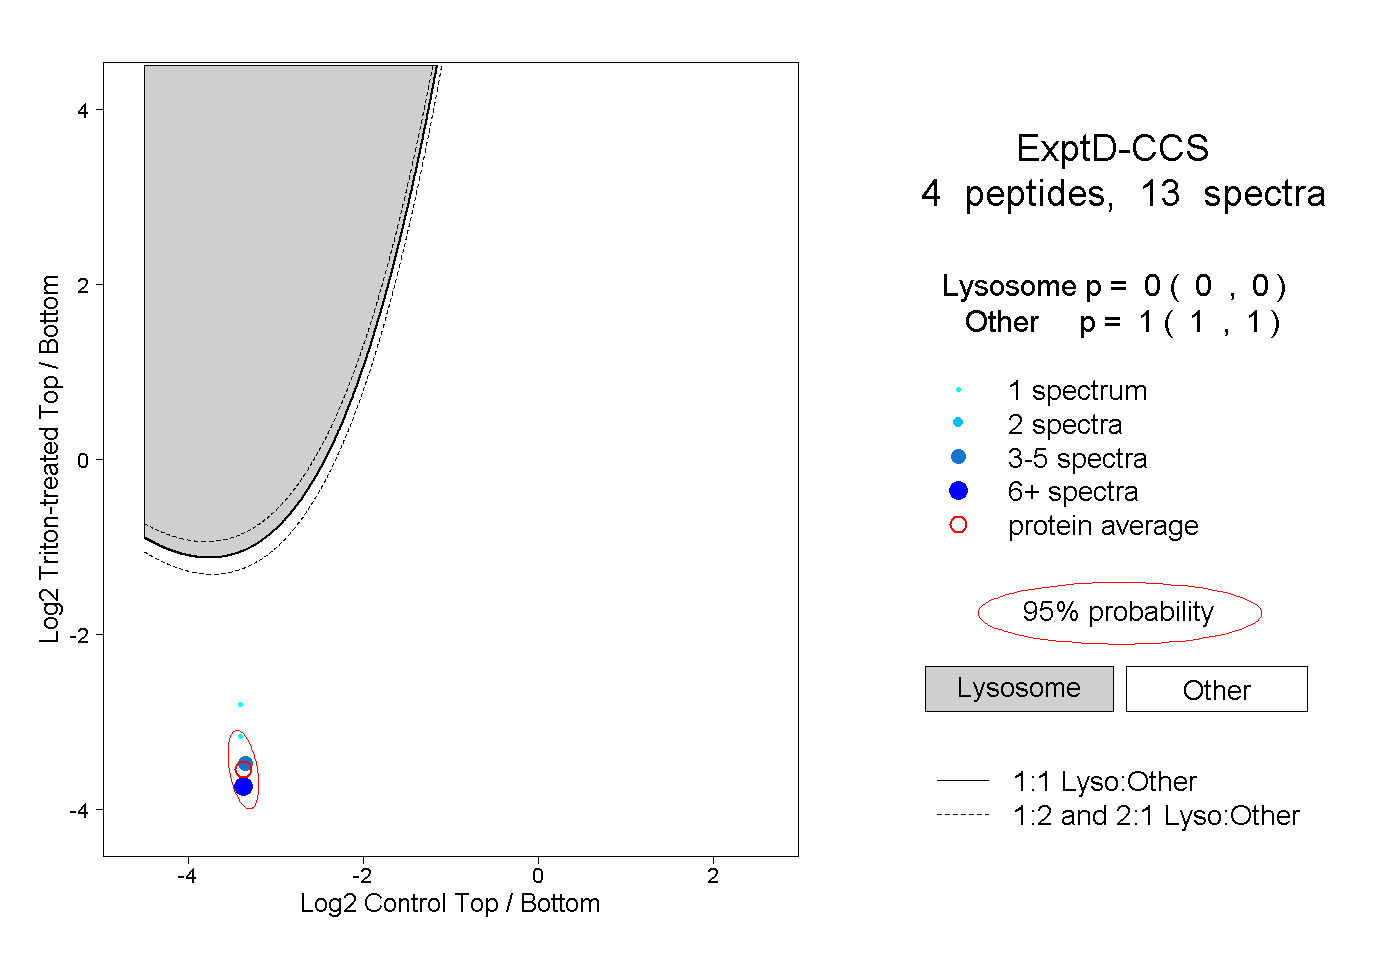 |
0.000 0.000 | 0.000 |
1.000 1.000 | 1.000 |