18
18peptides
spectra
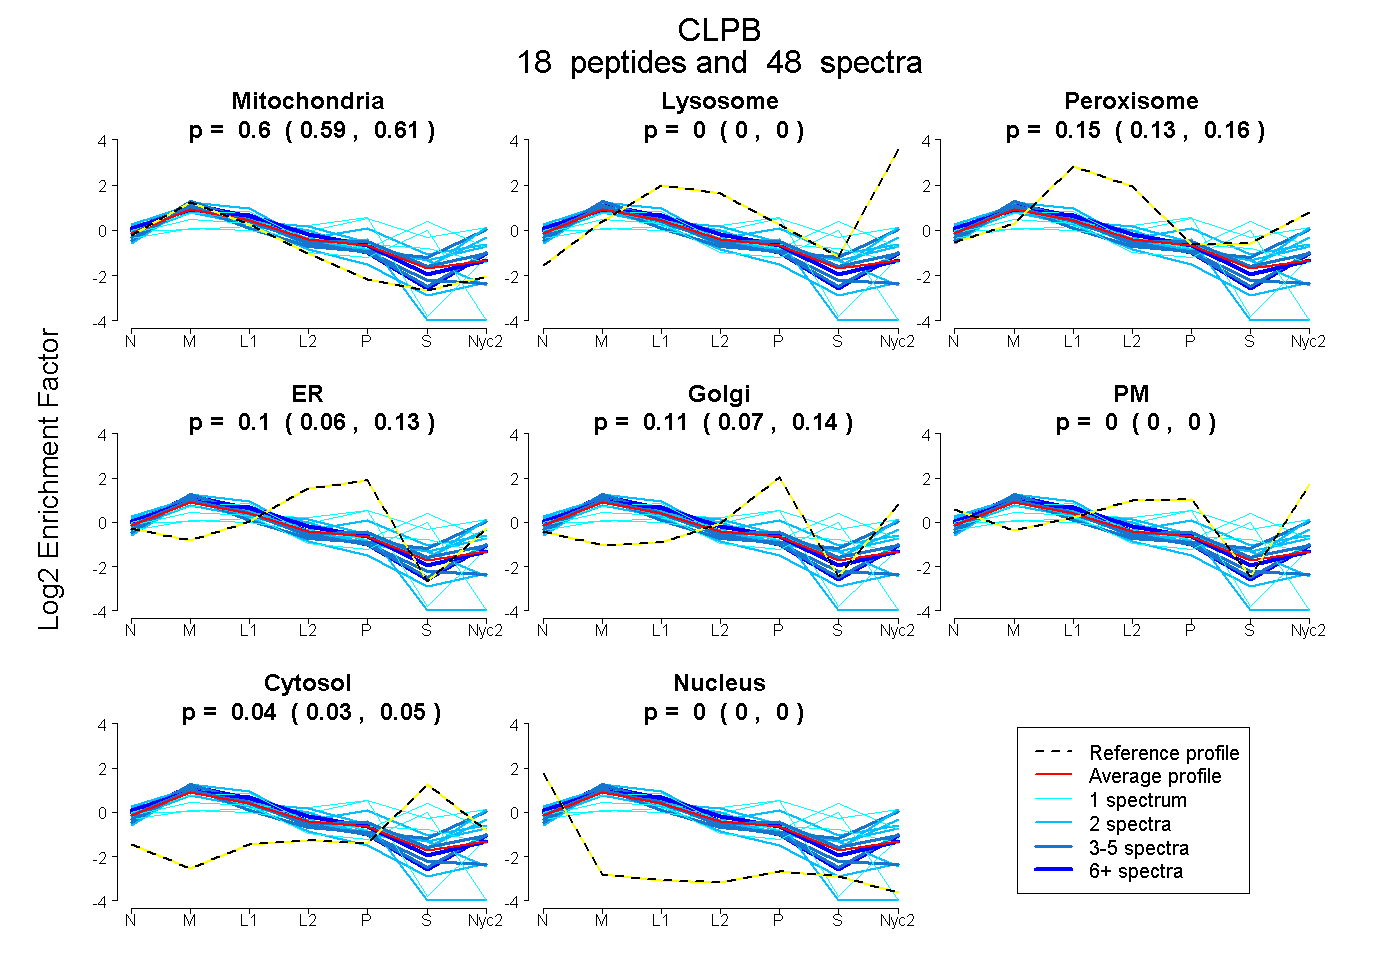
0.593 | 0.614
0.000 | 0.000
0.129 | 0.159
0.063 | 0.127
0.073 | 0.138
0.000 | 0.000
0.032 | 0.055
0.000 | 0.000
5peptides
spectra
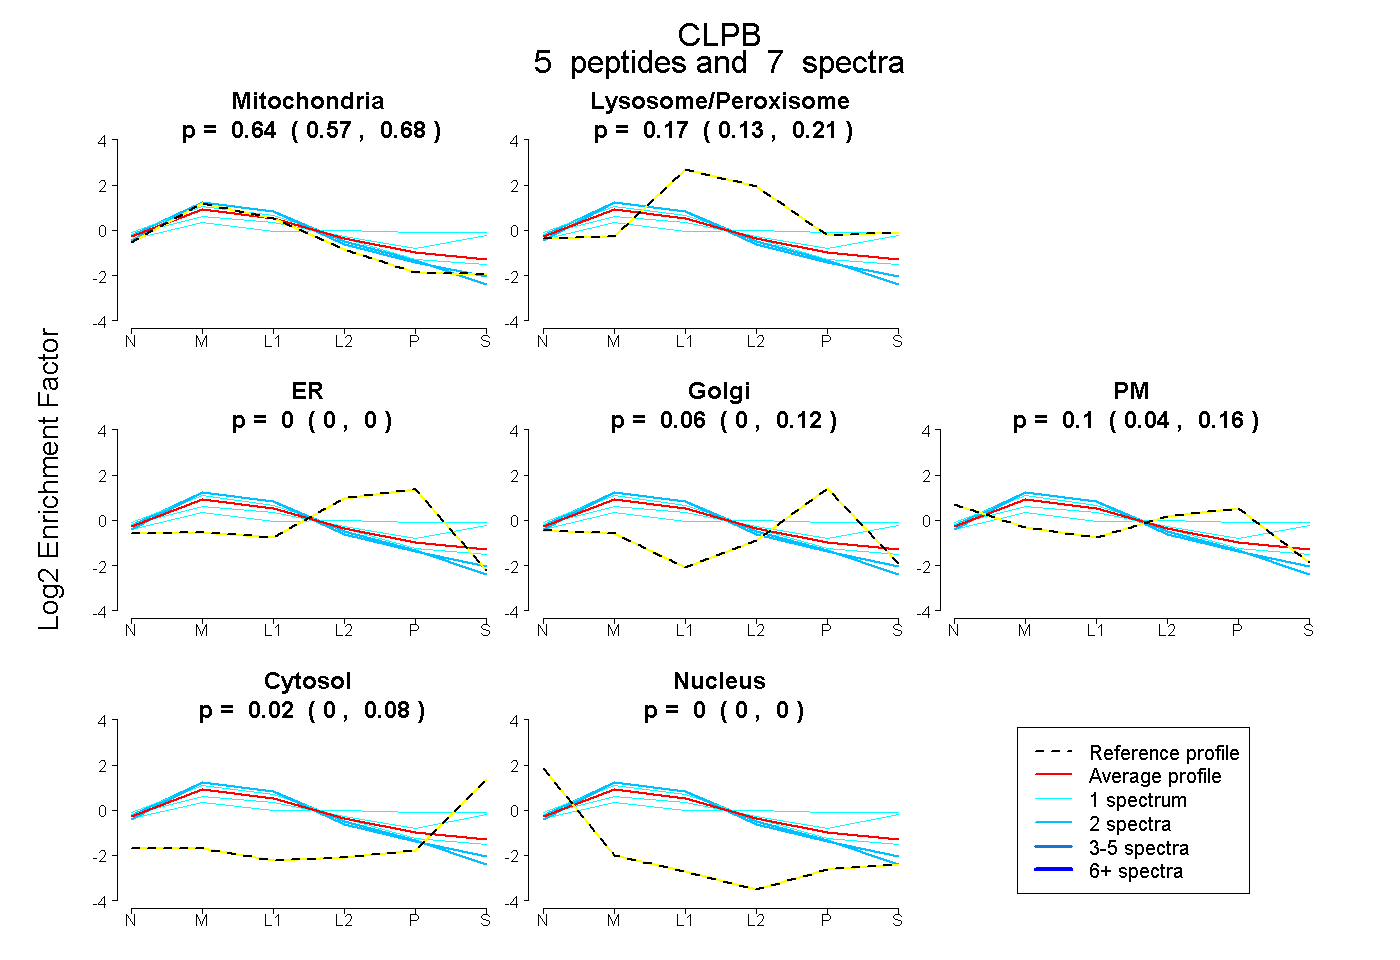
0.574 | 0.681
0.125 | 0.213
0.000 | 0.000
0.000 | 0.117
0.044 | 0.159
0.000 | 0.076
0.000 | 0.000
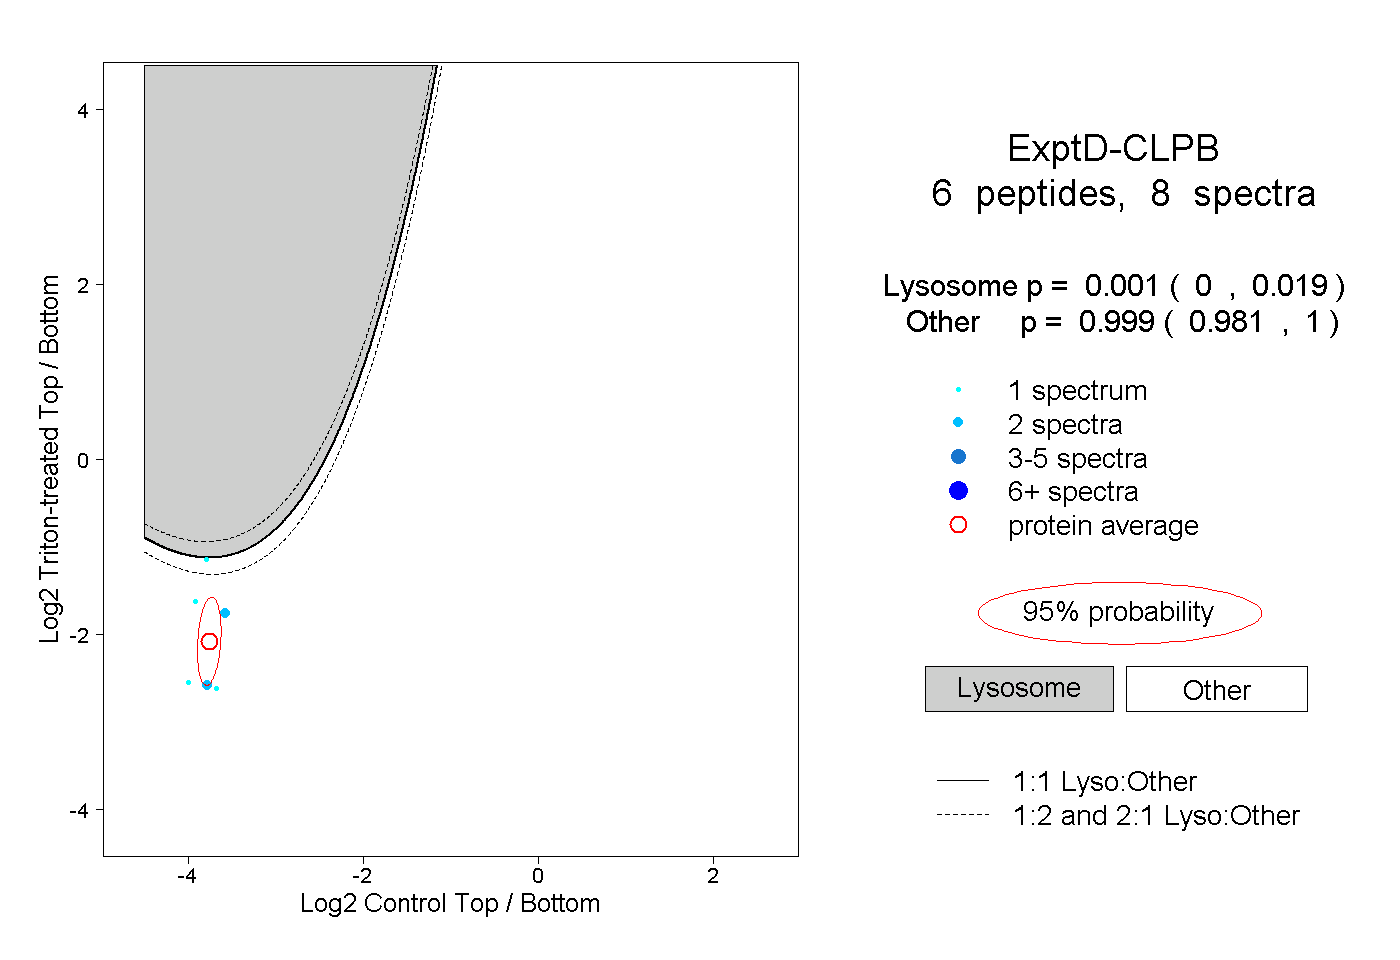
20peptides
spectra
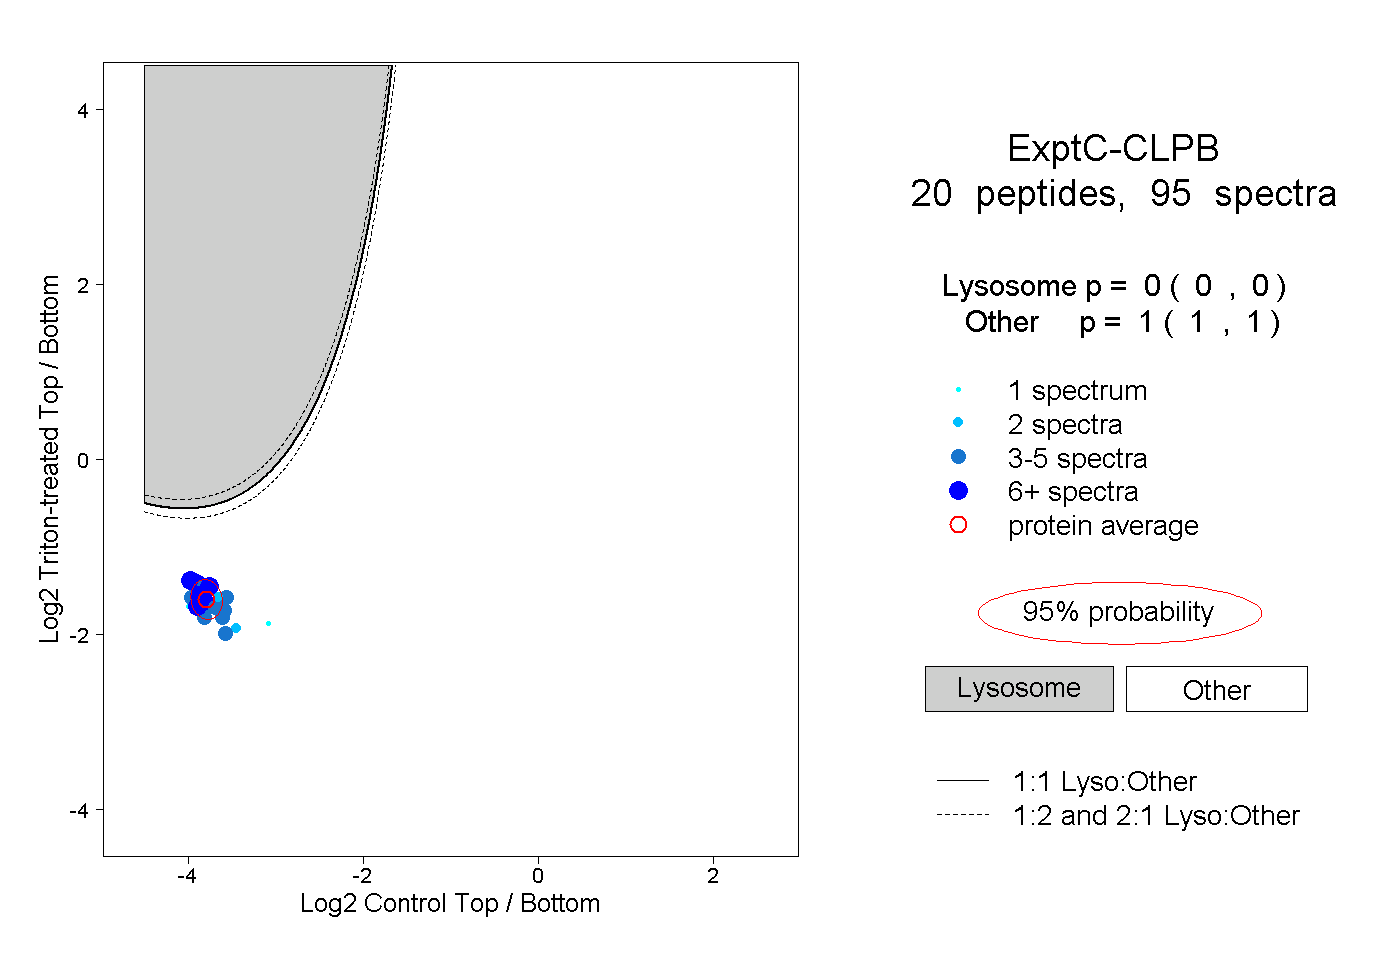
0.000 | 0.000
1.000 | 1.000