9
9peptides
spectra
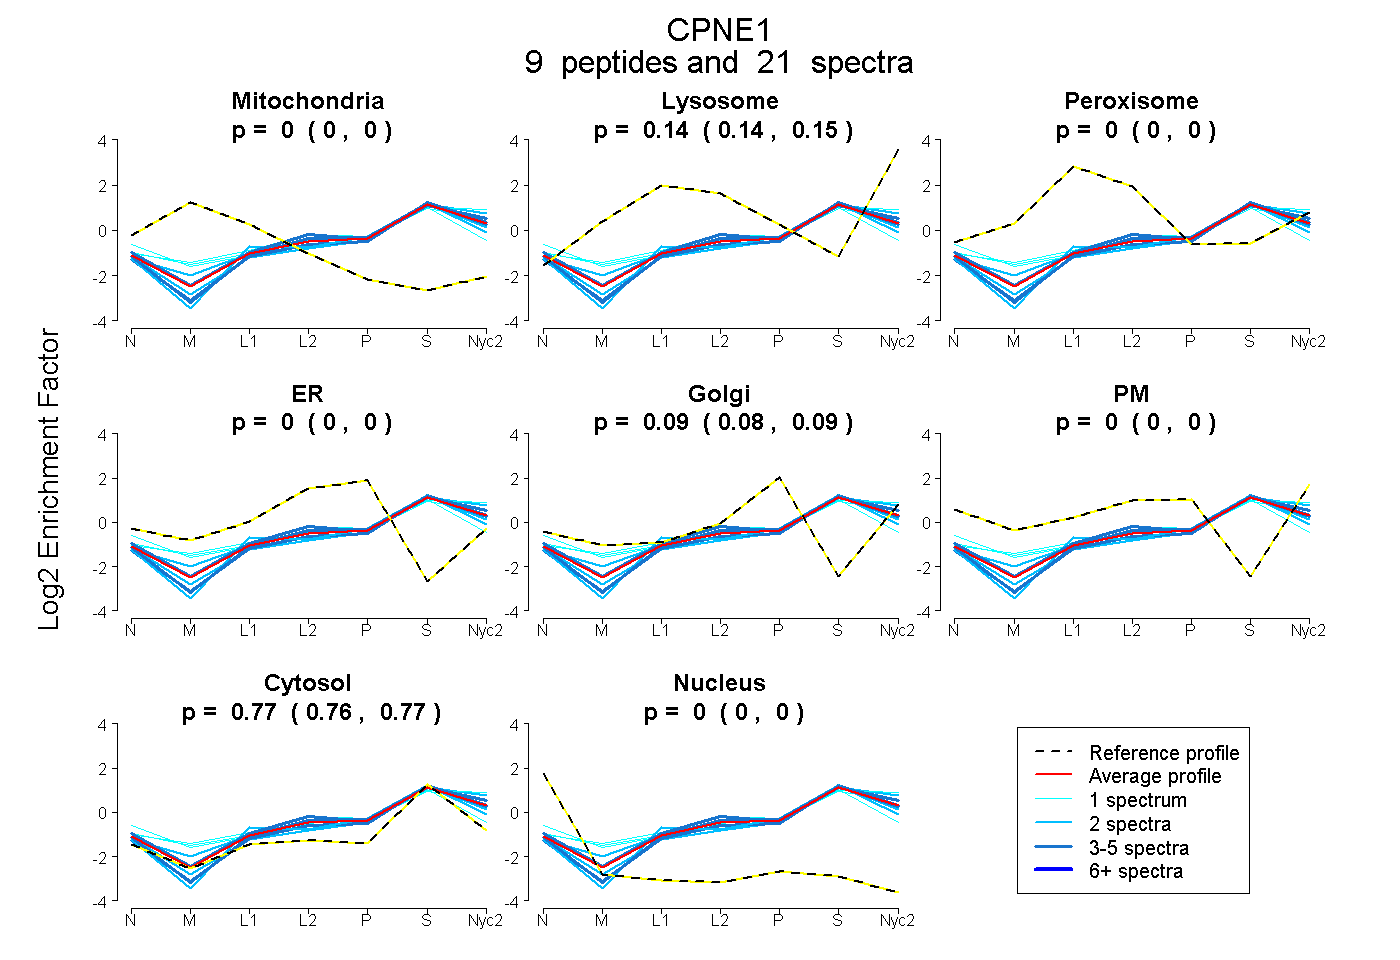
0.000 | 0.000
0.135 | 0.152
0.000 | 0.000
0.000 | 0.000
0.082 | 0.092
0.000 | 0.000
0.762 | 0.774
0.000 | 0.000
4peptides
spectra
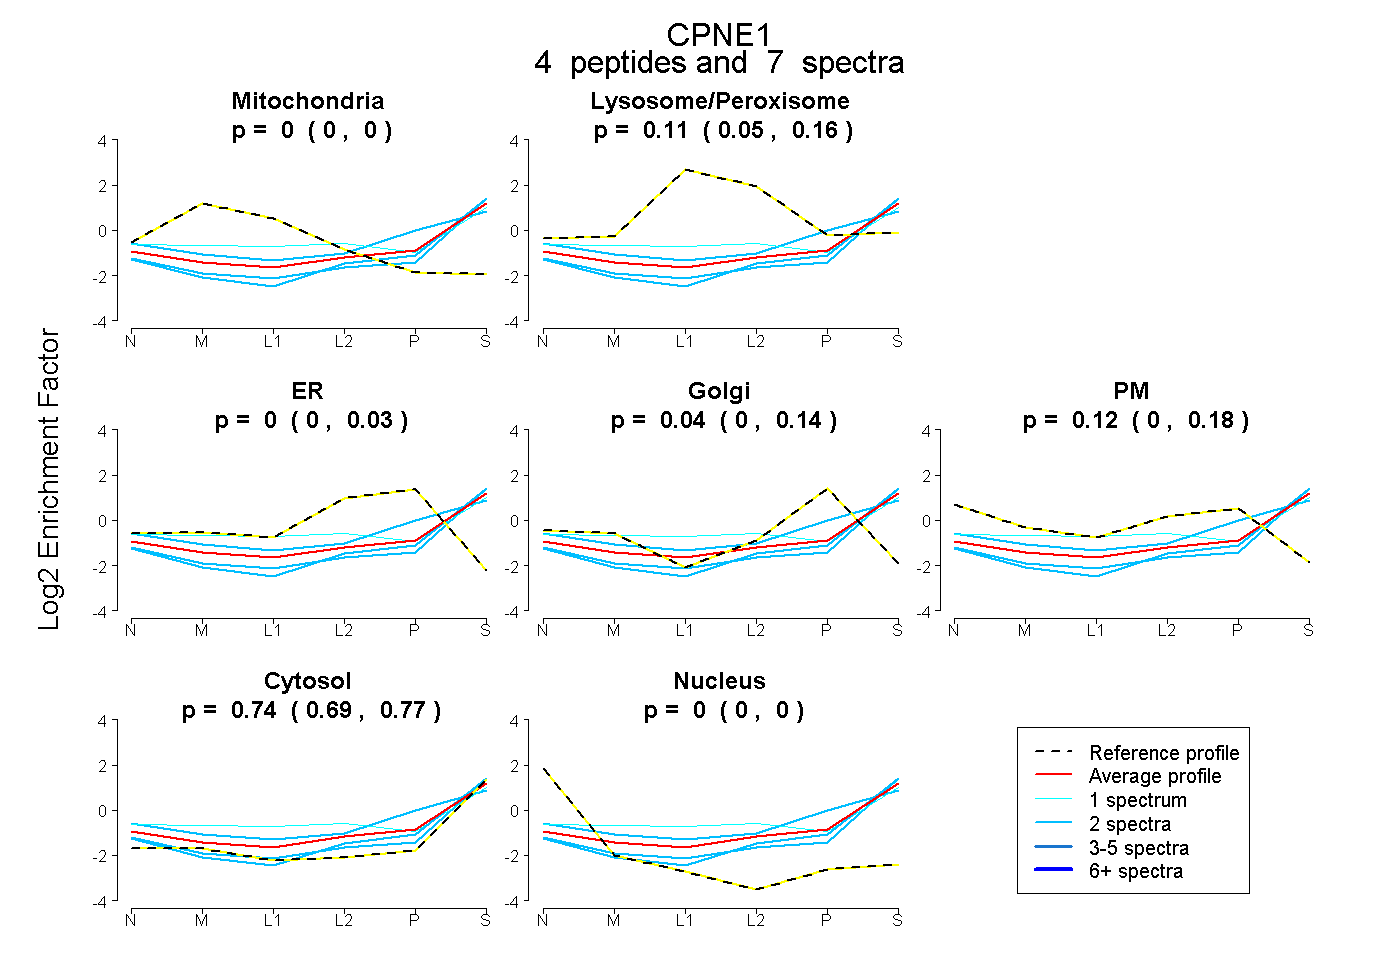
0.000 | 0.000
0.047 | 0.161
0.000 | 0.027
0.000 | 0.135
0.000 | 0.181
0.693 | 0.769
0.000 | 0.000