 27
27peptides
spectra
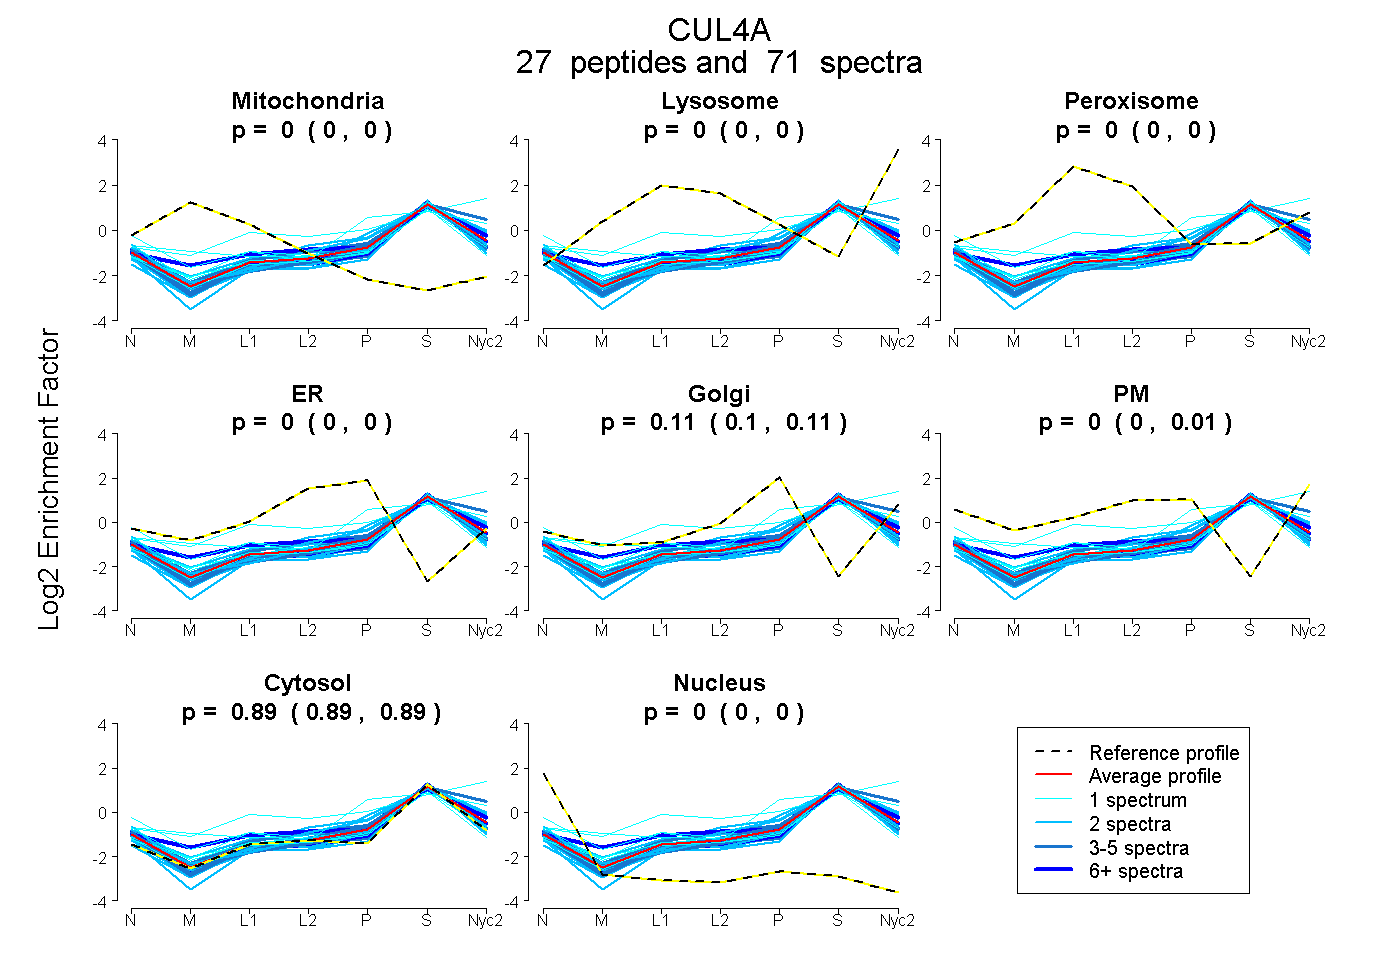
0.000 | 0.000
0.000 | 0.000
0.000 | 0.000
0.000 | 0.000
0.104 | 0.114
0.000 | 0.007
0.885 | 0.890
0.000 | 0.000
10peptides
spectra
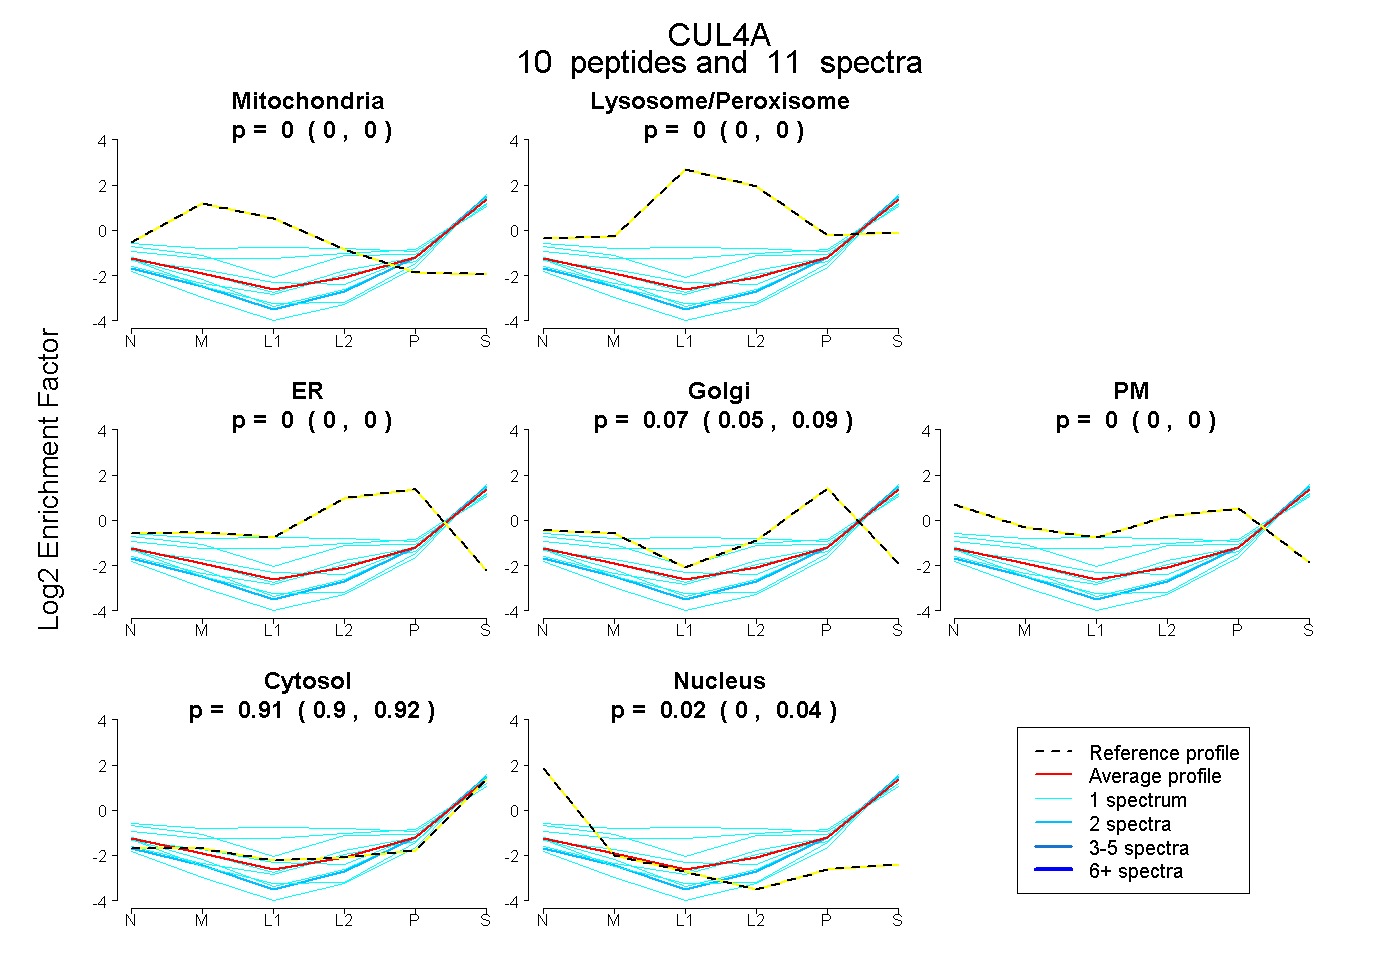
0.000 | 0.000
0.000 | 0.000
0.000 | 0.000
0.054 | 0.089
0.000 | 0.000
0.896 | 0.918
0.000 | 0.036
22peptides
spectra
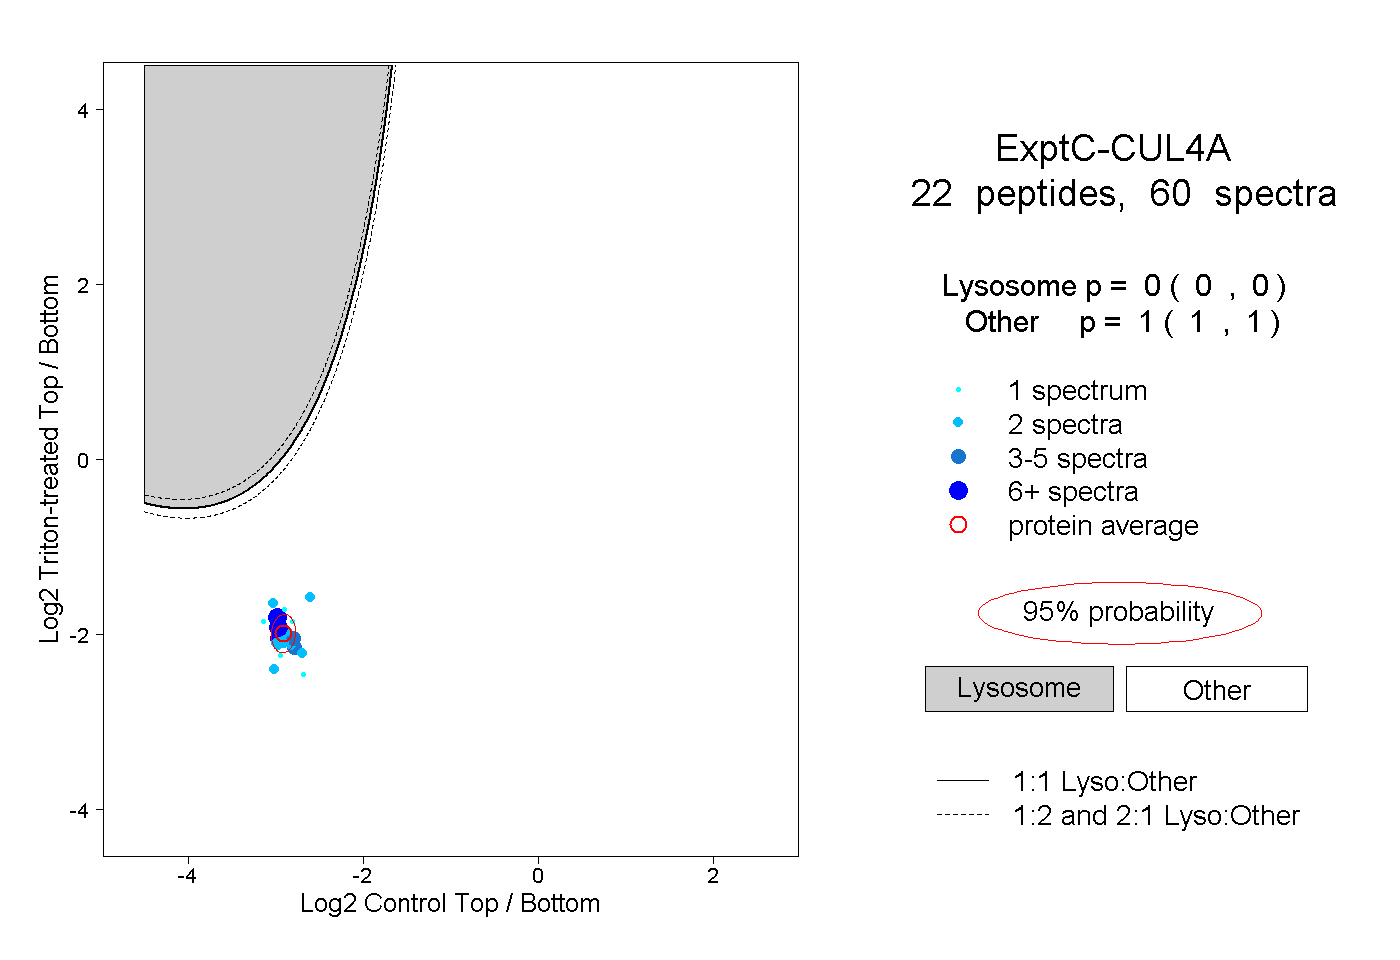
0.000 | 0.000
1.000 | 1.000
4peptides
spectra
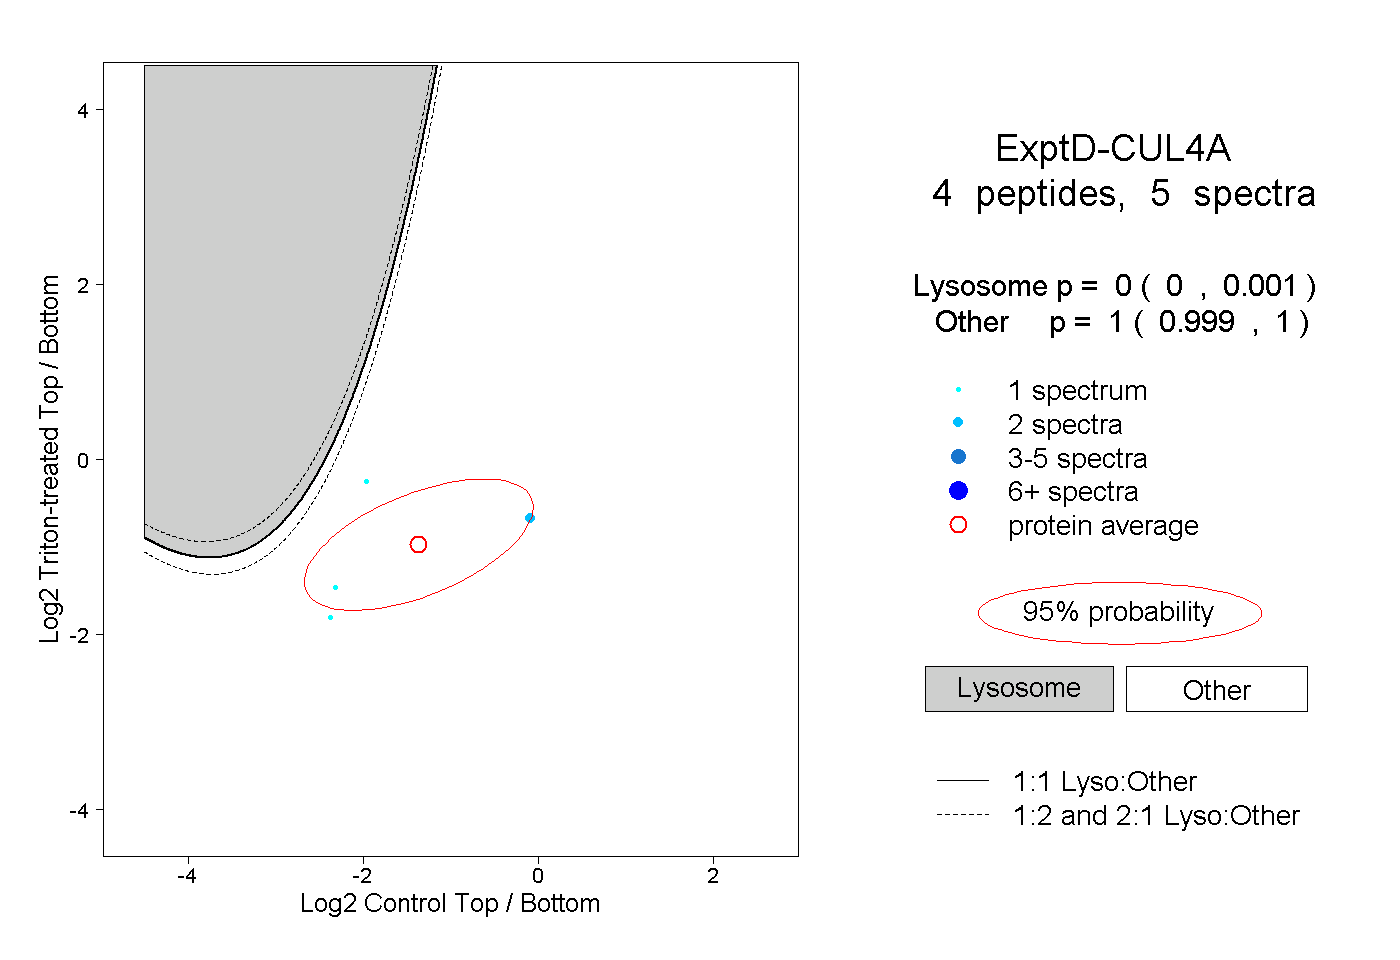
0.000 | 0.001
0.999 | 1.000