 3
3peptides
spectra
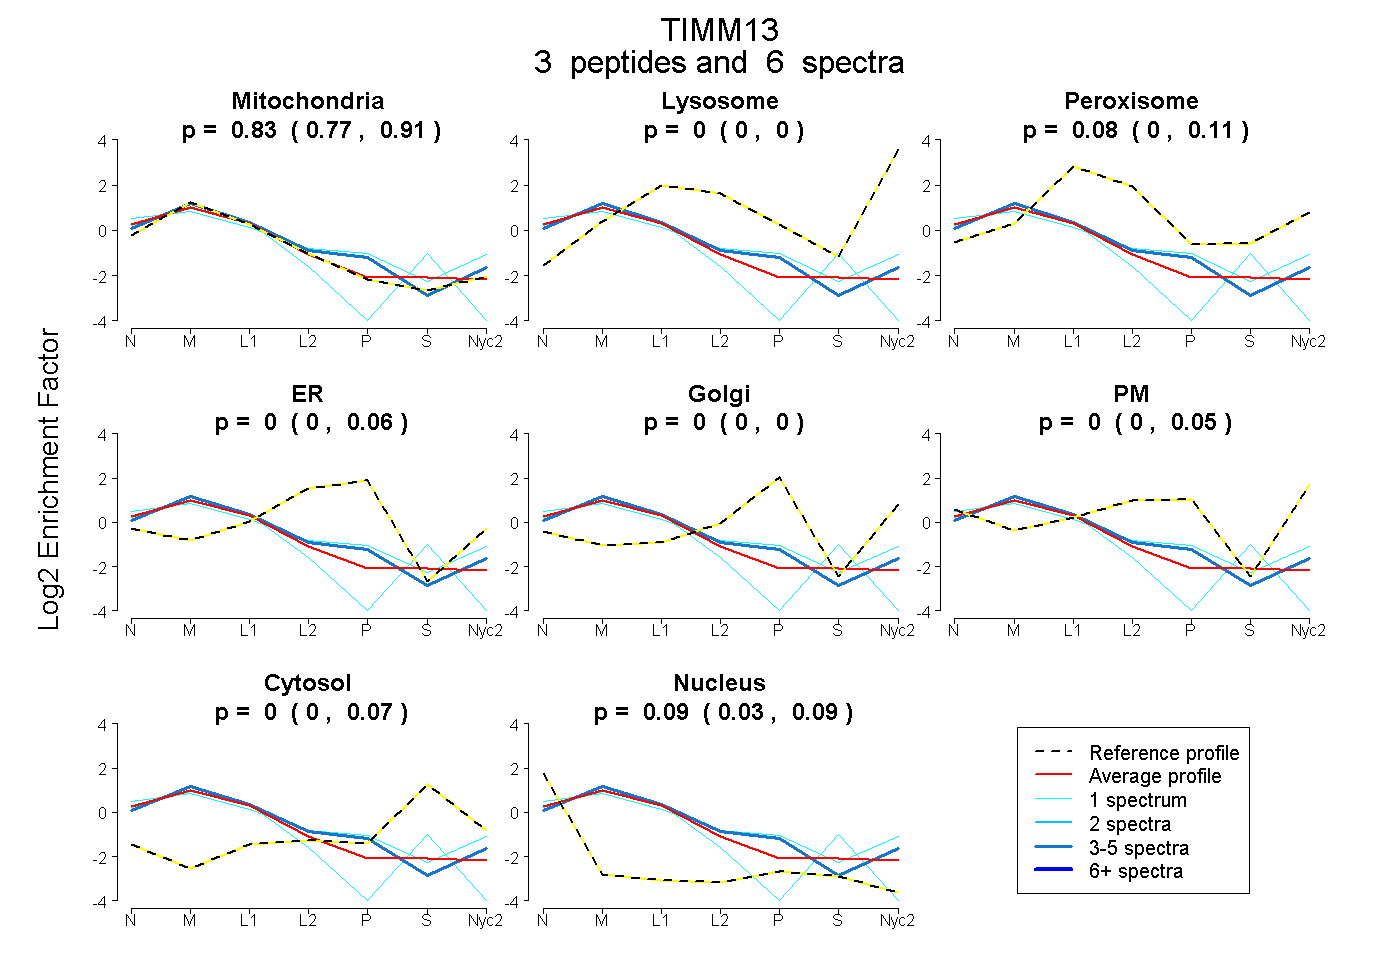
0.765 | 0.913
0.000 | 0.000
0.000 | 0.109
0.000 | 0.060
0.000 | 0.001
0.000 | 0.049
0.000 | 0.071
0.027 | 0.094
2peptides
spectra
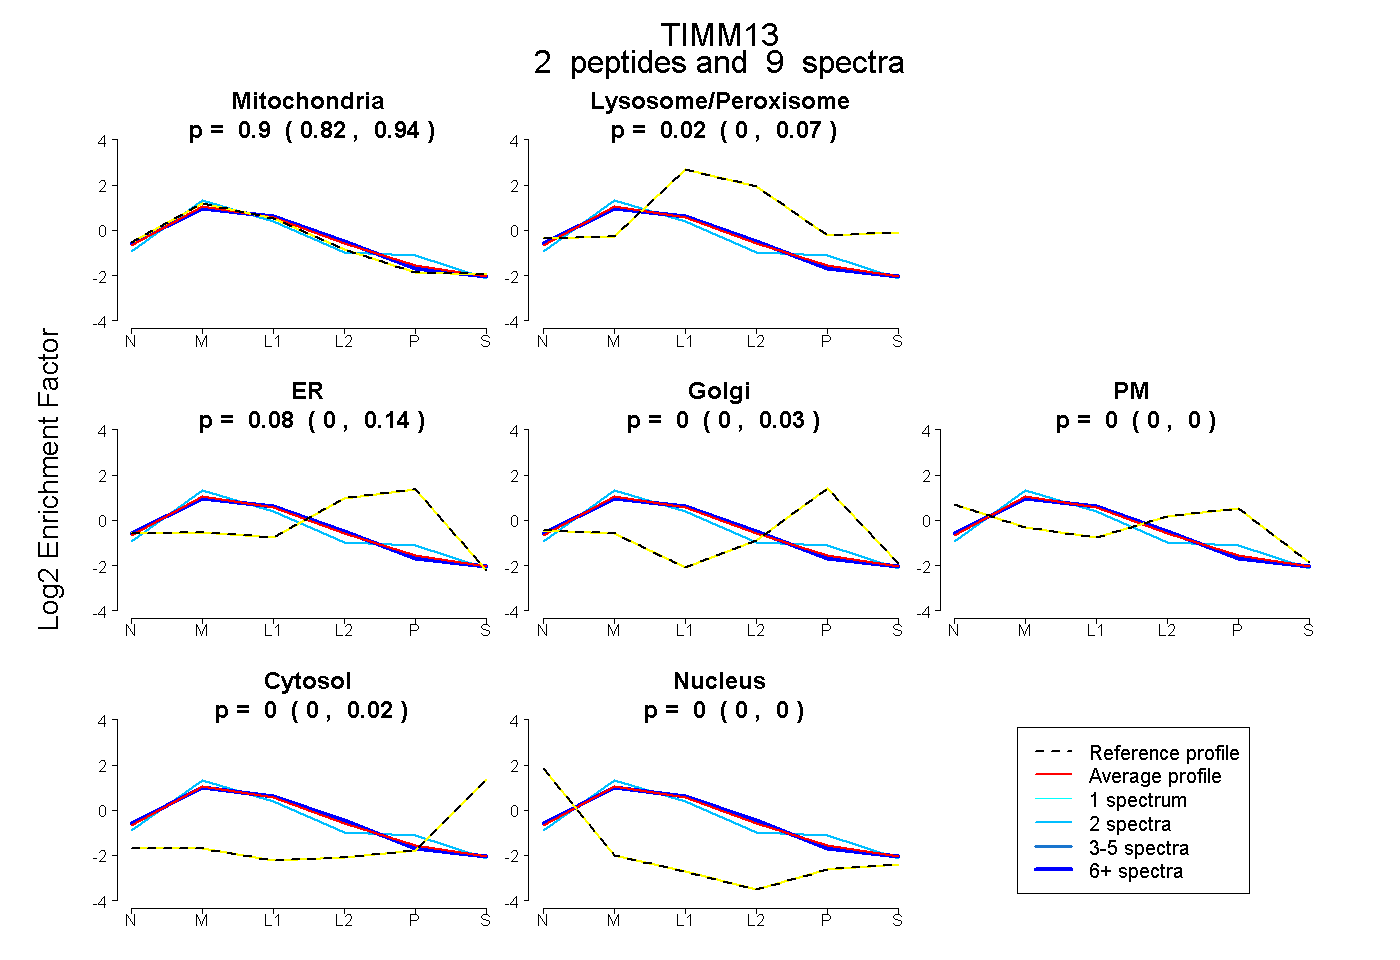
0.822 | 0.944
0.000 | 0.073
0.000 | 0.138
0.000 | 0.025
0.000 | 0.000
0.000 | 0.018
0.000 | 0.000
6peptides
spectra
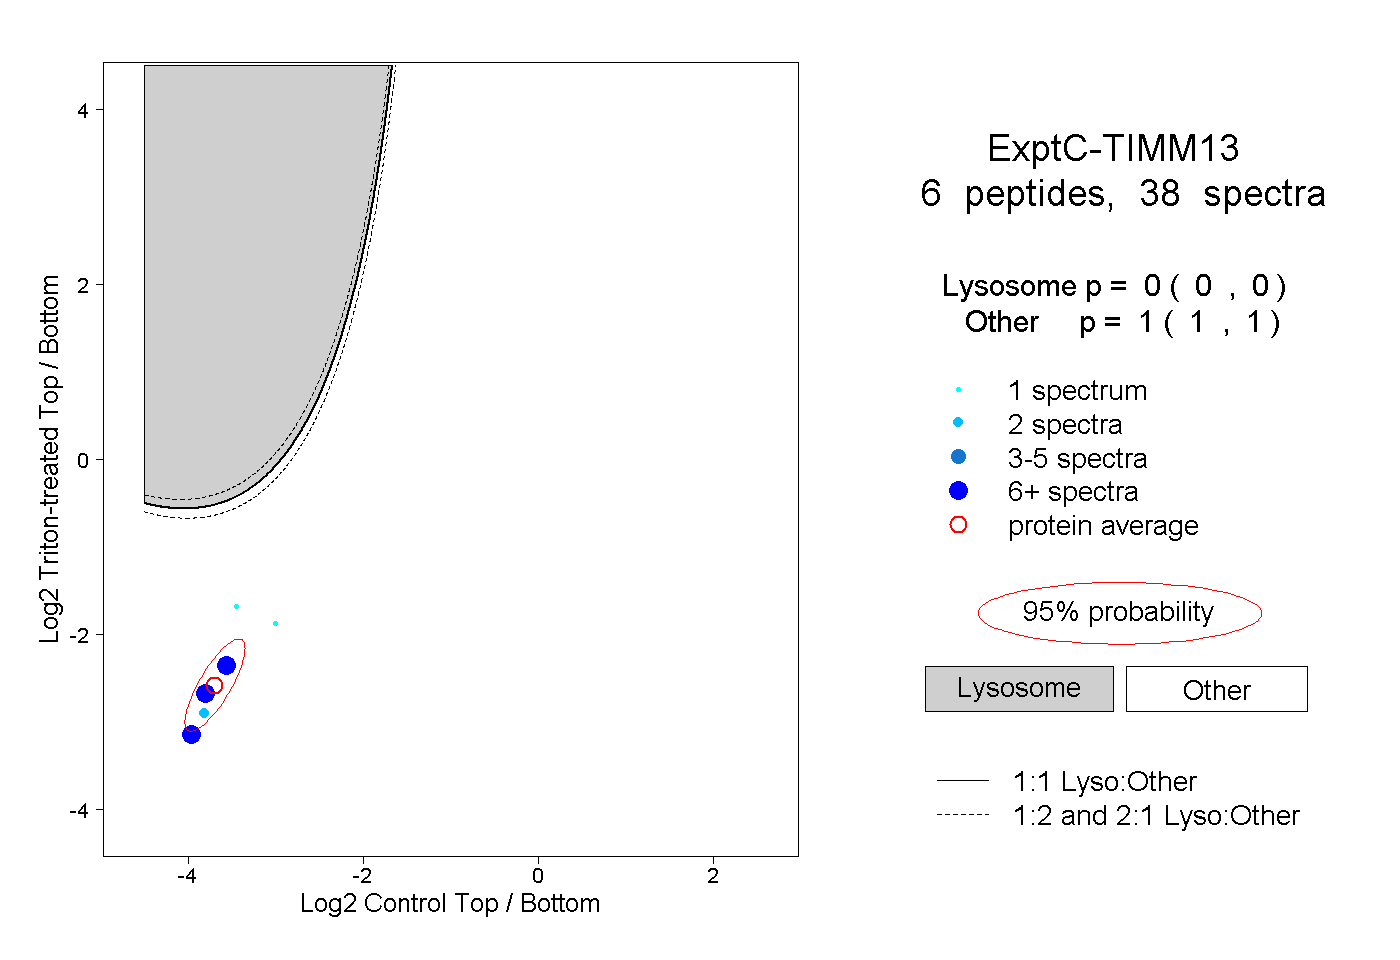
0.000 | 0.000
1.000 | 1.000
1peptide
spectra
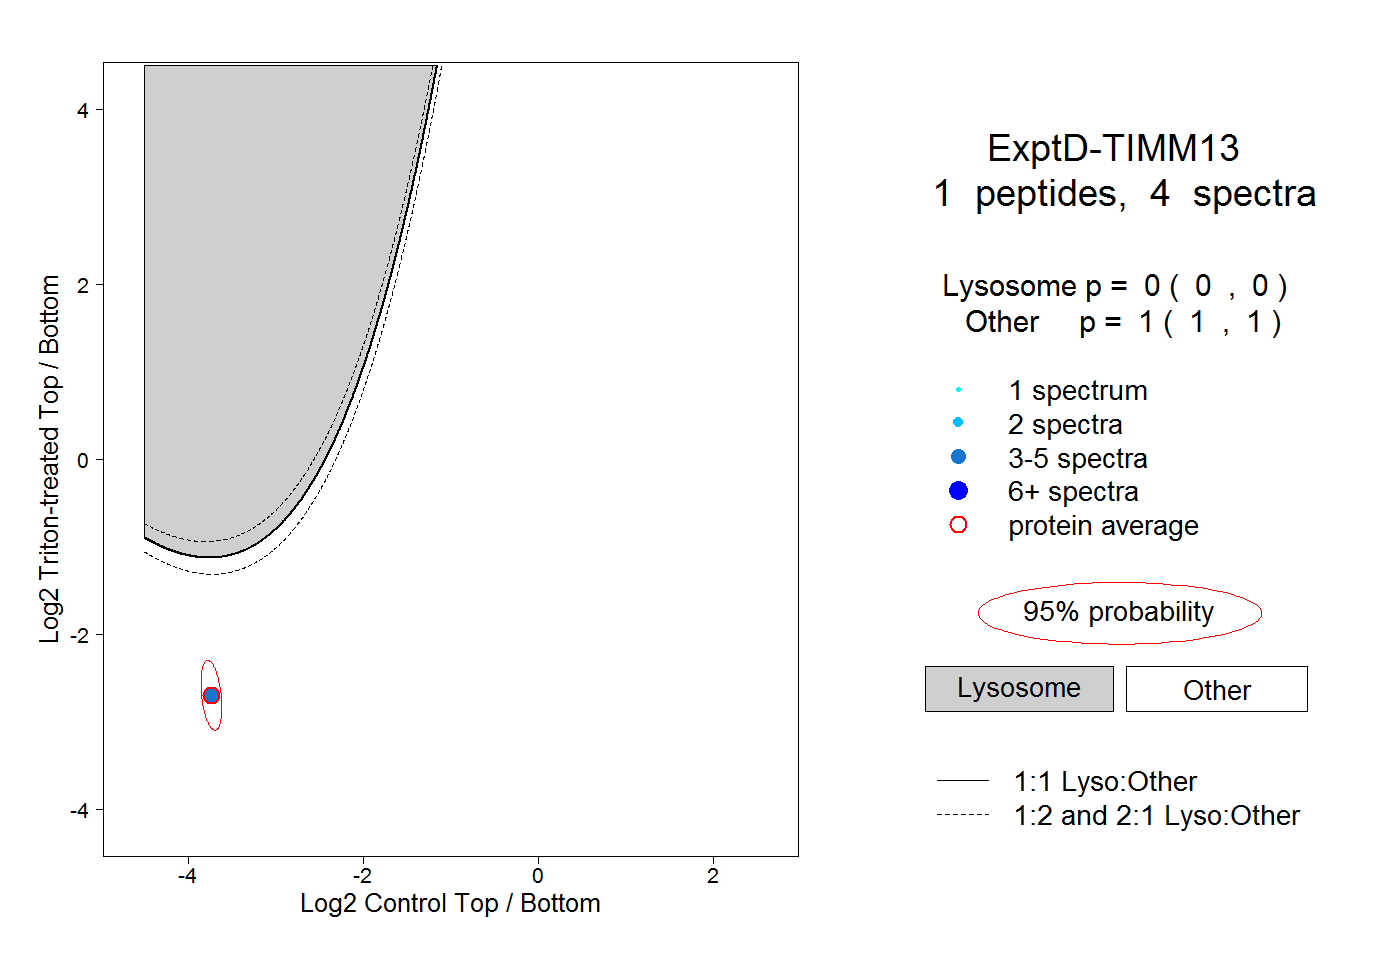
0.000 | 0.000
1.000 | 1.000