 3
3peptides
spectra
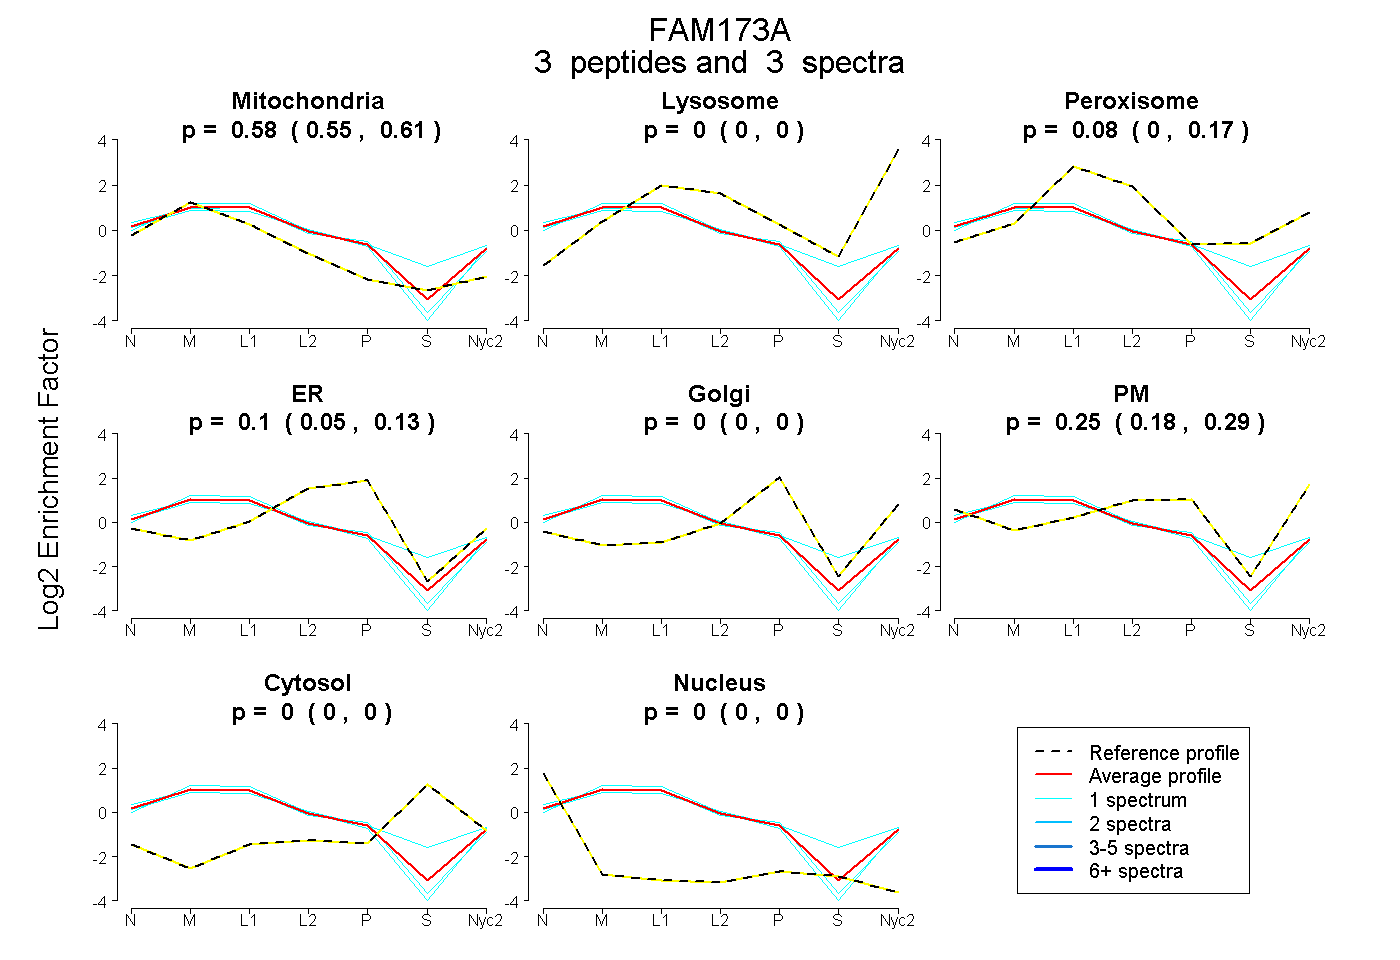
0.546 | 0.607
0.000 | 0.000
0.000 | 0.167
0.050 | 0.133
0.000 | 0.000
0.180 | 0.294
0.000 | 0.000
0.000 | 0.000
1peptide
spectra
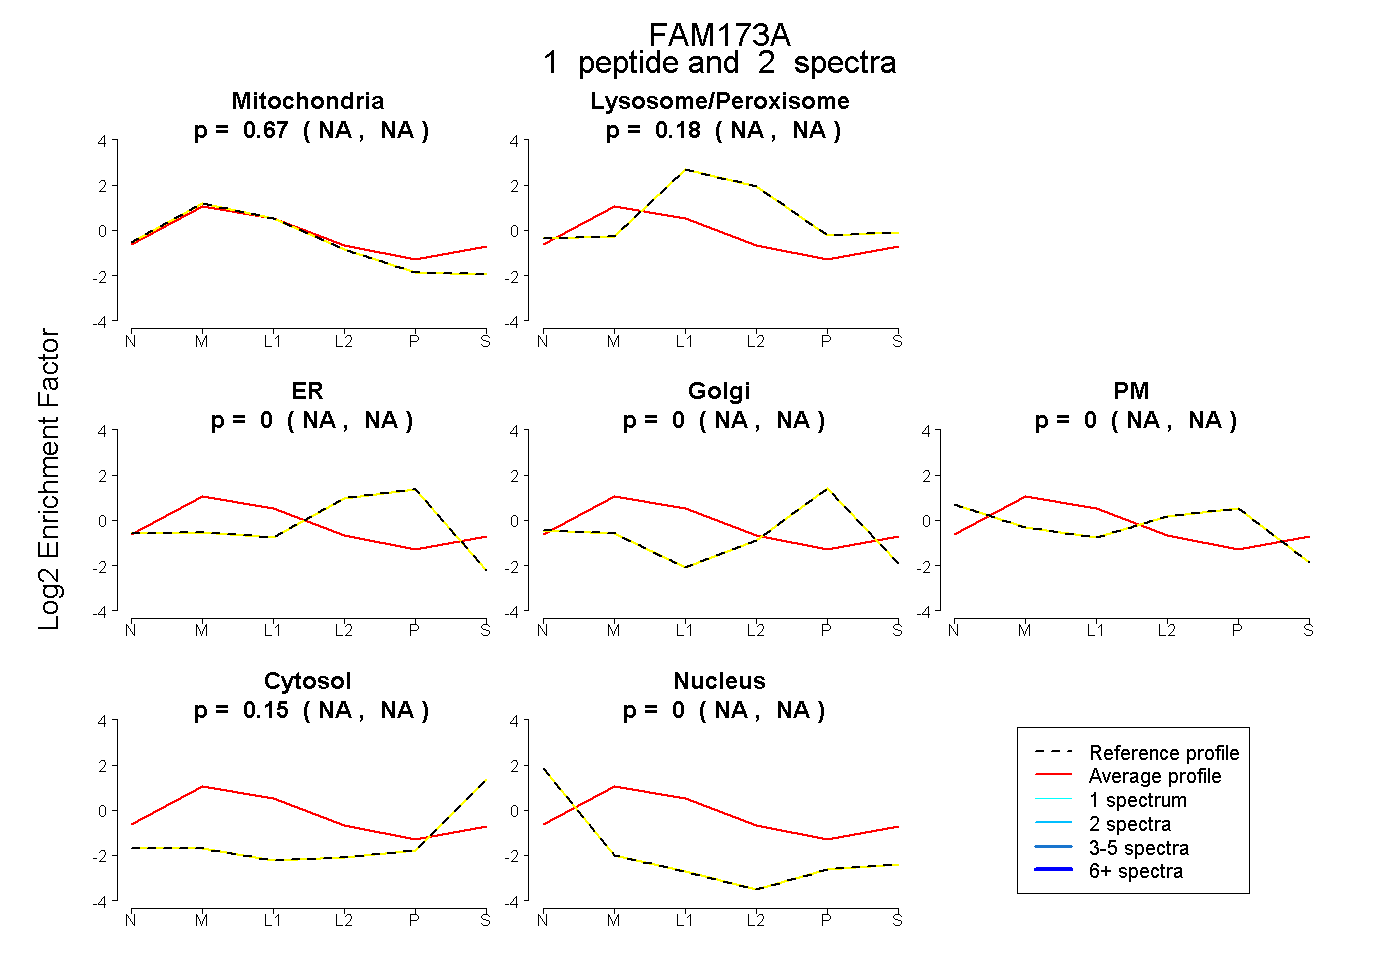
NA | NA
NA | NA
NA | NA
NA | NA
NA | NA
NA | NA
NA | NA
4peptides
spectra
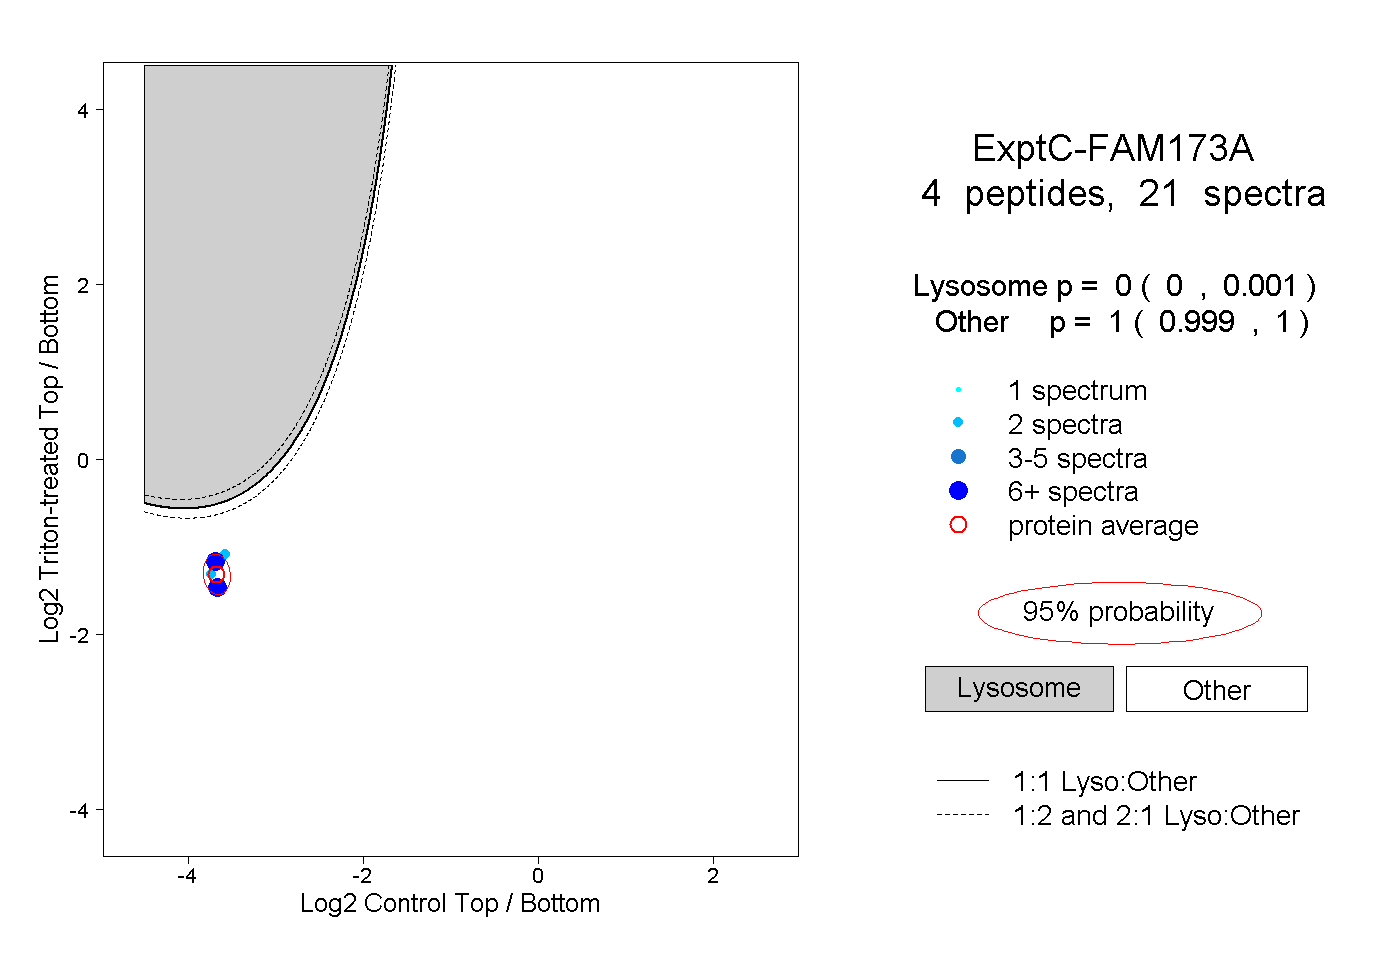
0.000 | 0.001
0.999 | 1.000