8
8peptides
spectra
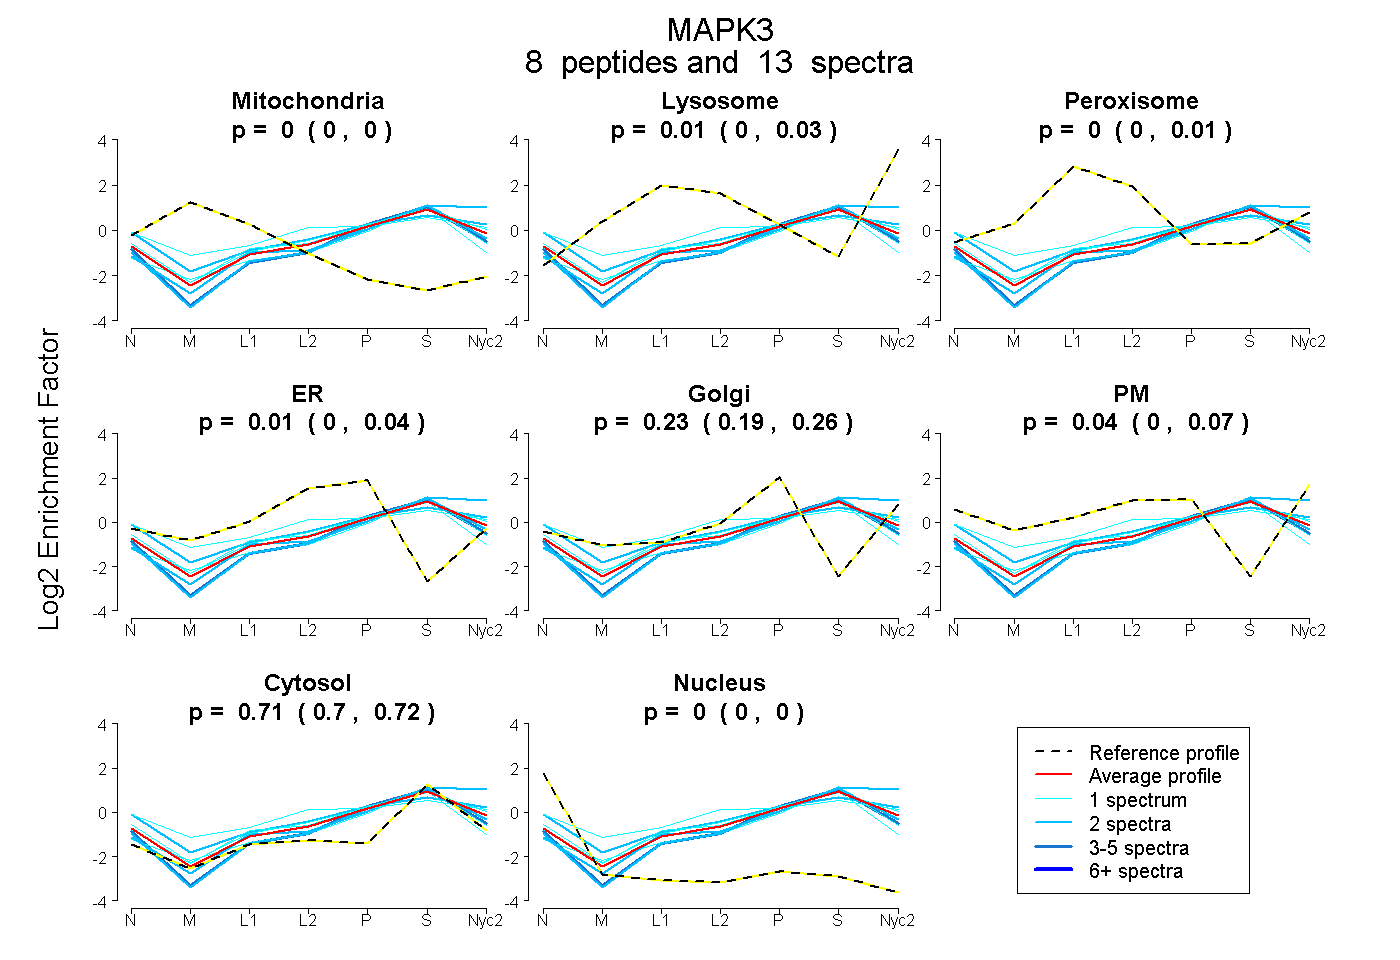
0.000 | 0.000
0.000 | 0.033
0.000 | 0.015
0.000 | 0.042
0.192 | 0.259
0.000 | 0.069
0.701 | 0.722
0.000 | 0.000
6peptides
spectra
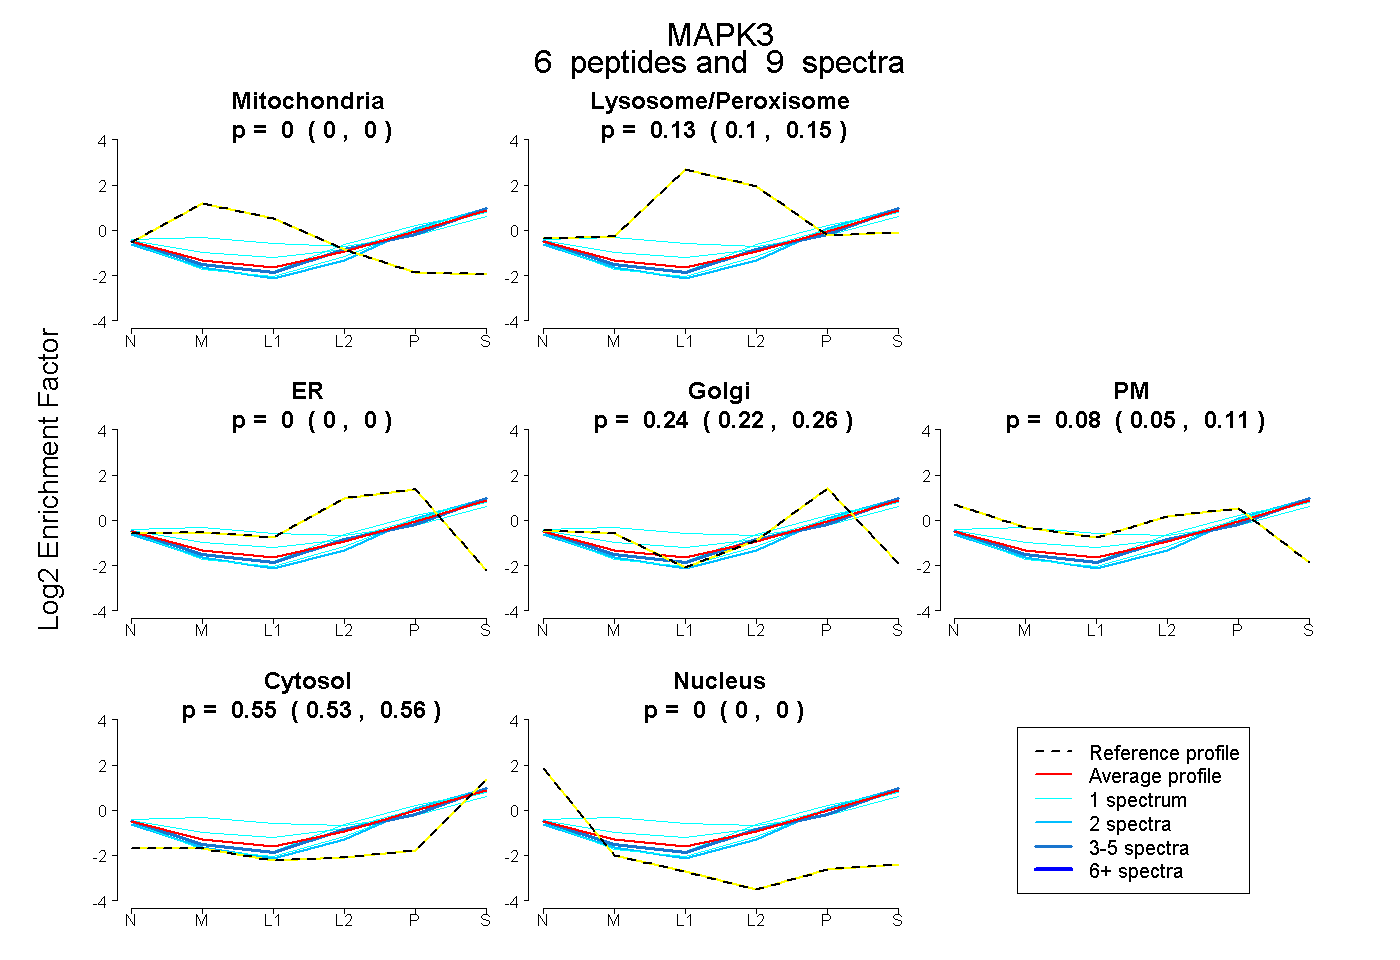
0.000 | 0.000
0.100 | 0.153
0.000 | 0.000
0.217 | 0.262
0.046 | 0.109
0.534 | 0.560
0.000 | 0.000