 8
8peptides
spectra
0.000 | 0.000
0.000 | 0.033
0.000 | 0.015
0.000 | 0.042
0.192 | 0.259
0.000 | 0.069
0.701 | 0.722
0.000 | 0.000
| Plot | Mito | Lyso | Perox | ER | Golgi | PM | Cytosol | Nucleus | |||||
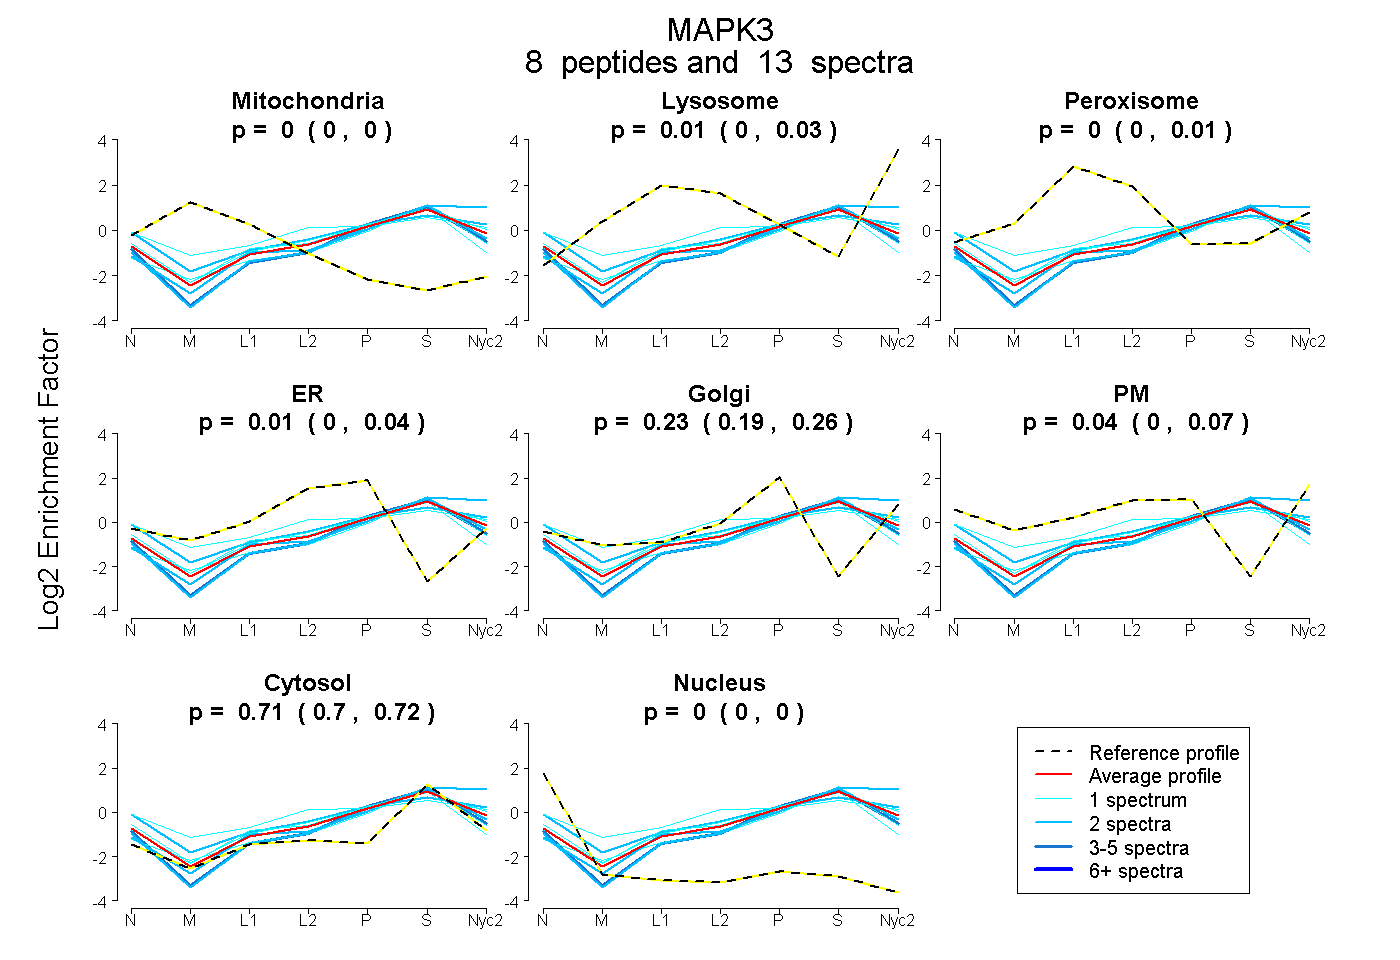
| Expt A |
8 peptides |
13 spectra |
|
0.000 0.000 | 0.000 |
0.013 0.000 | 0.033 |
0.000 0.000 | 0.015 |
0.006 0.000 | 0.042 |
0.229 0.192 | 0.259 |
0.039 0.000 | 0.069 |
0.714 0.701 | 0.722 |
0.000 0.000 | 0.000 |
| 3 spectra, AIDILDR | 0.000 | 0.000 | 0.000 | 0.000 | 0.206 | 0.000 | 0.794 | 0.000 | ||
| 1 spectrum, GTAGVVPVVPGEVEVVK | 0.000 | 0.000 | 0.000 | 0.258 | 0.000 | 0.000 | 0.742 | 0.000 | ||
| 1 spectrum, NYIQSLPSK | 0.000 | 0.023 | 0.000 | 0.009 | 0.153 | 0.135 | 0.680 | 0.000 | ||
| 2 spectra, ELIFQETAR | 0.000 | 0.155 | 0.000 | 0.000 | 0.128 | 0.000 | 0.718 | 0.000 | ||
| 1 spectrum, HENVIGIR | 0.000 | 0.000 | 0.099 | 0.040 | 0.000 | 0.330 | 0.532 | 0.000 | ||
| 2 spectra, EIQILLR | 0.000 | 0.000 | 0.000 | 0.000 | 0.191 | 0.000 | 0.809 | 0.000 | ||
| 1 spectrum, APTLEAMR | 0.000 | 0.000 | 0.000 | 0.000 | 0.202 | 0.000 | 0.798 | 0.000 | ||
| 2 spectra, GQPFDVGPR | 0.000 | 0.000 | 0.000 | 0.000 | 0.048 | 0.337 | 0.615 | 0.000 |
| Plot | Mito | Lyso or Perox | ER | Golgi | PM | Cytosol | Nucleus | ||||||
| Expt B |
6 peptides |
9 spectra |
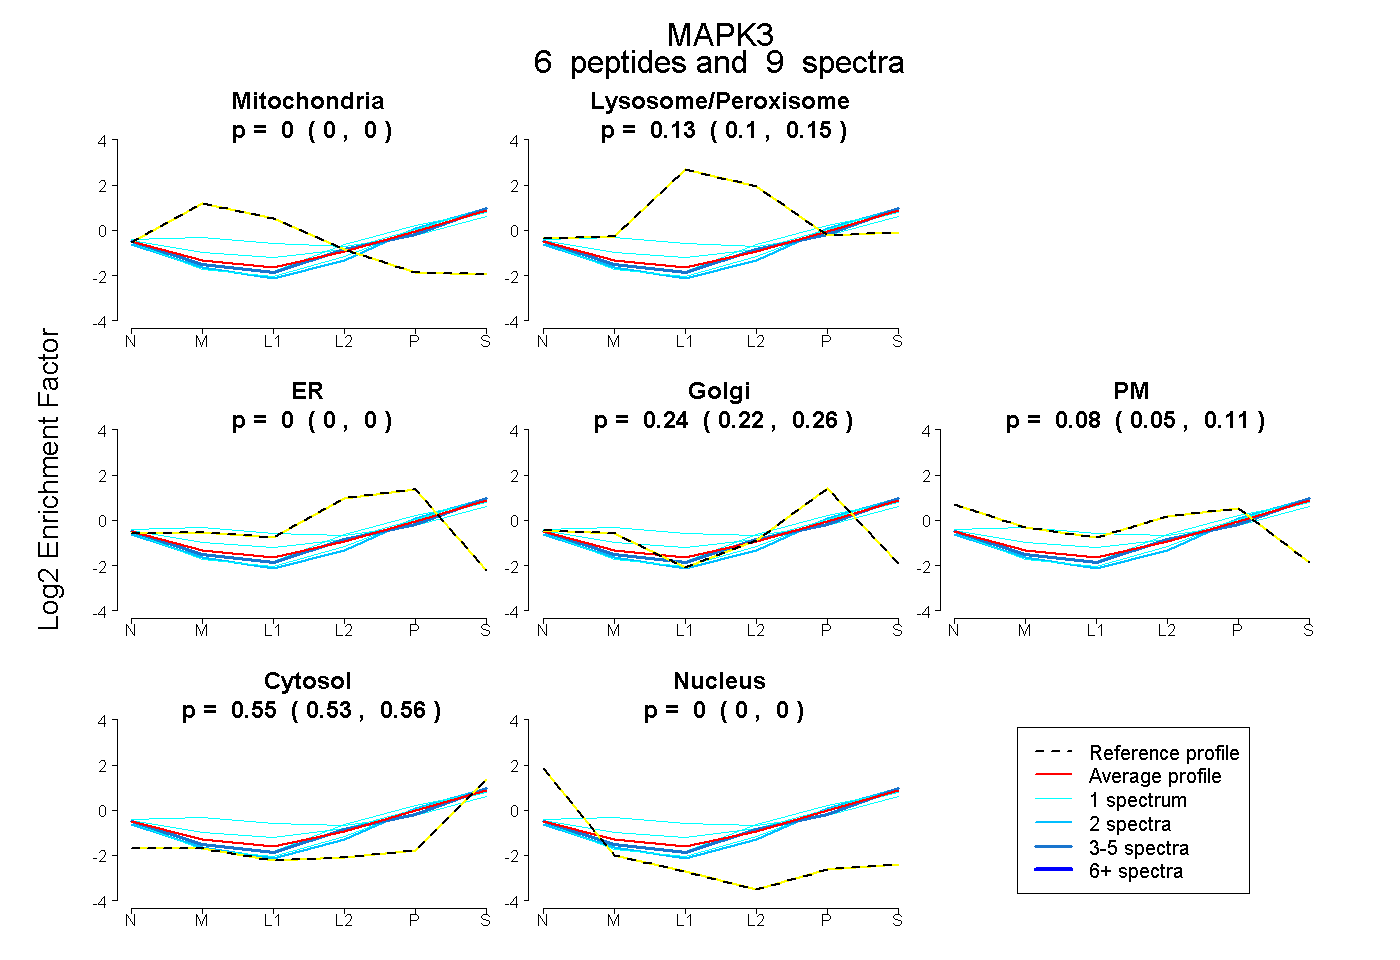 |
0.000 0.000 | 0.000 |
0.130 0.100 | 0.153 |
0.000 0.000 | 0.000 |
0.242 0.217 | 0.262 |
0.080 0.046 | 0.109 |
0.548 0.534 | 0.560 |
0.000 0.000 | 0.000 |
|||
| Plot | Lyso | Other | |||||||||||
| Expt C |
4 peptides |
11 spectra |
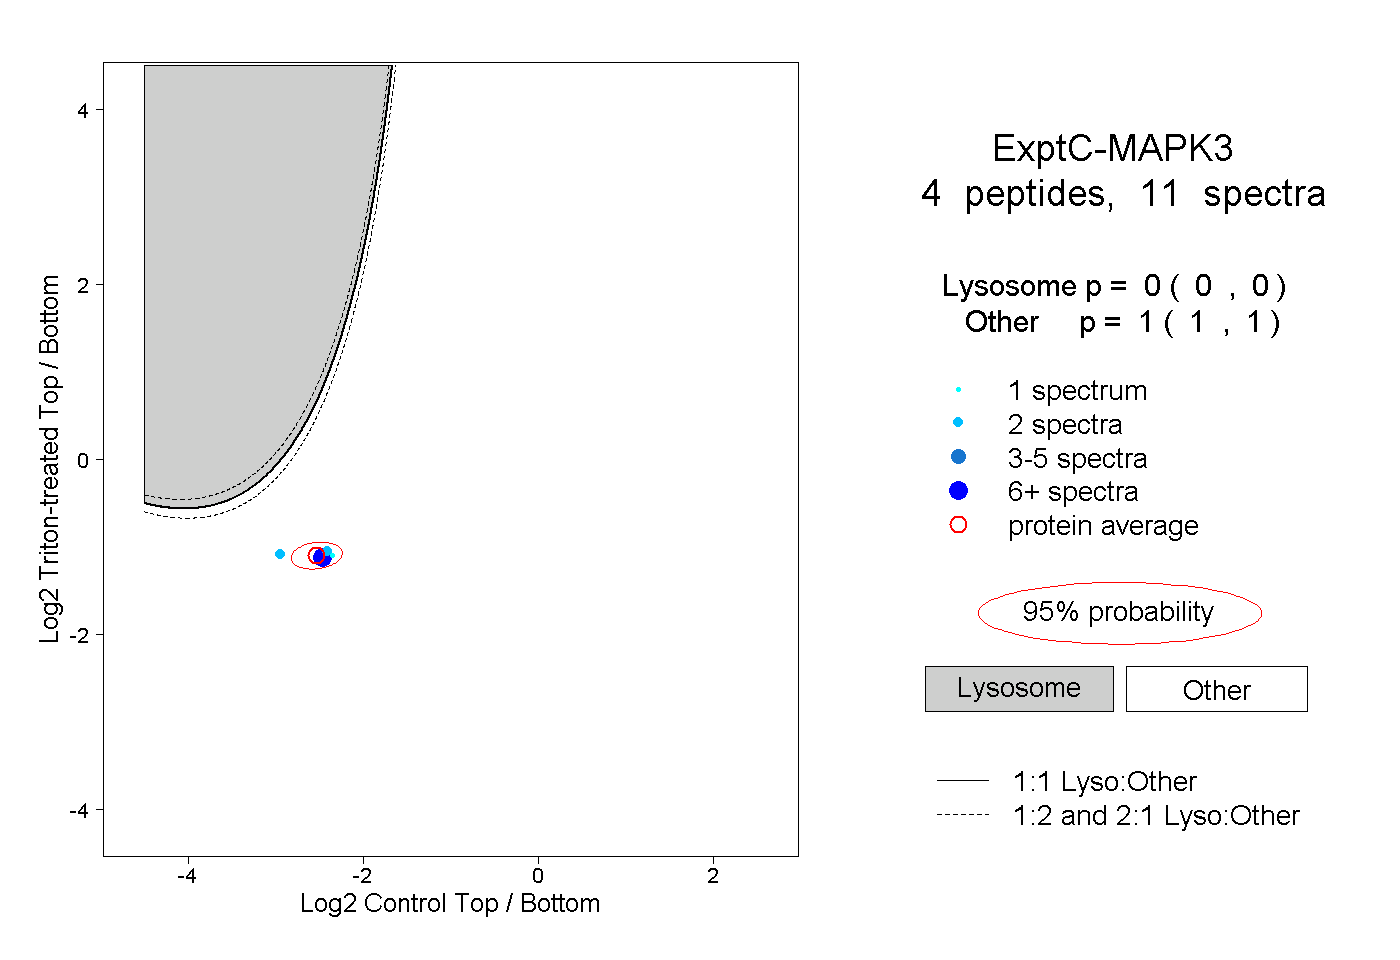 |
0.000 0.000 | 0.000 |
1.000 1.000 | 1.000 |