15
15peptides
spectra
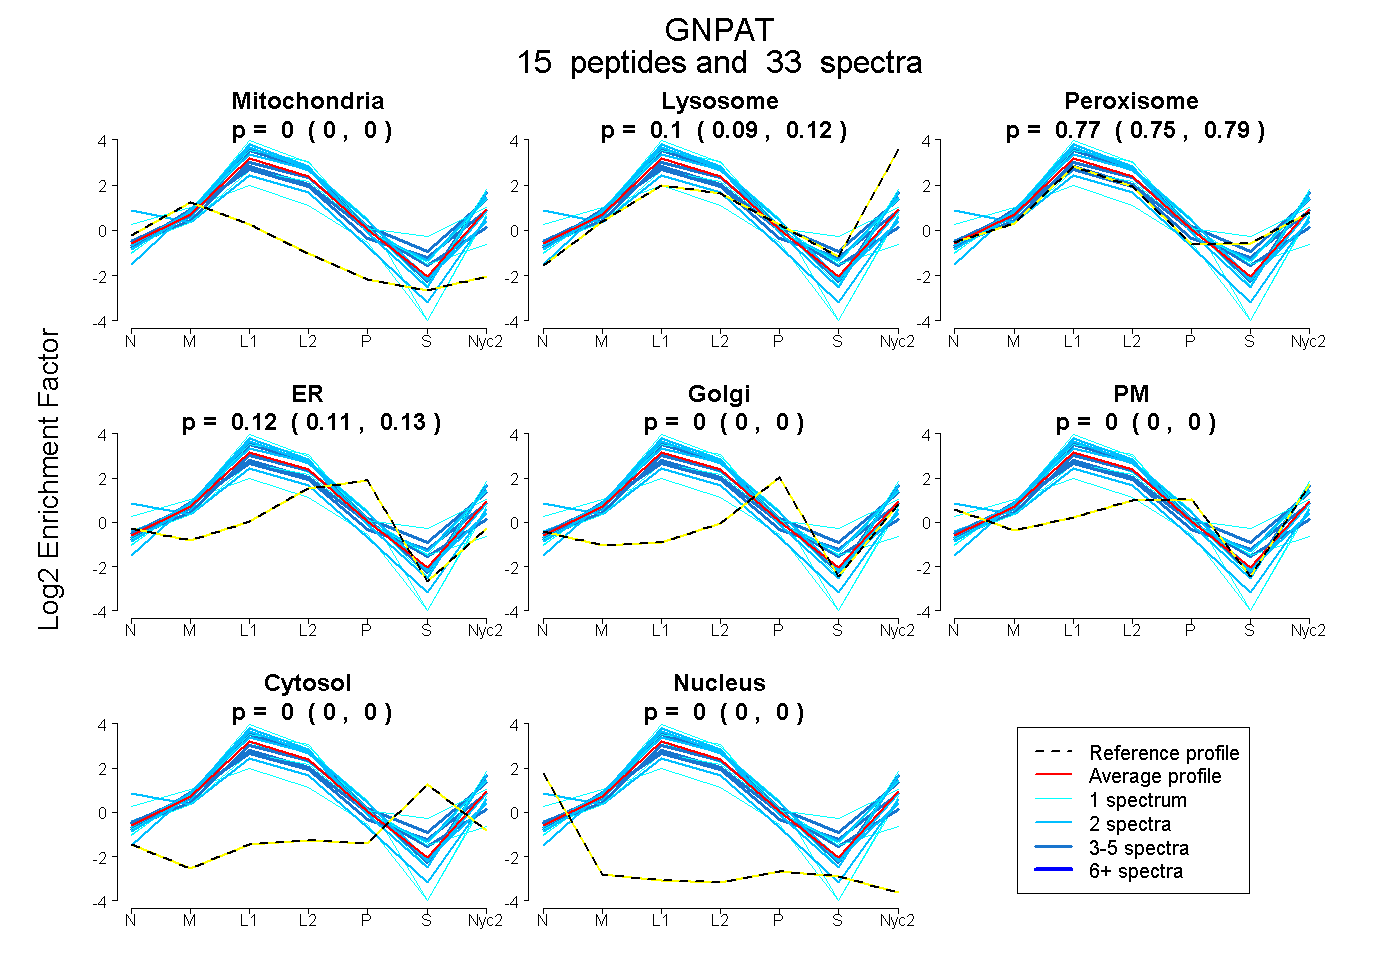
0.000 | 0.000
0.086 | 0.118
0.754 | 0.790
0.111 | 0.133
0.000 | 0.000
0.000 | 0.000
0.000 | 0.000
0.000 | 0.000
7peptides
spectra
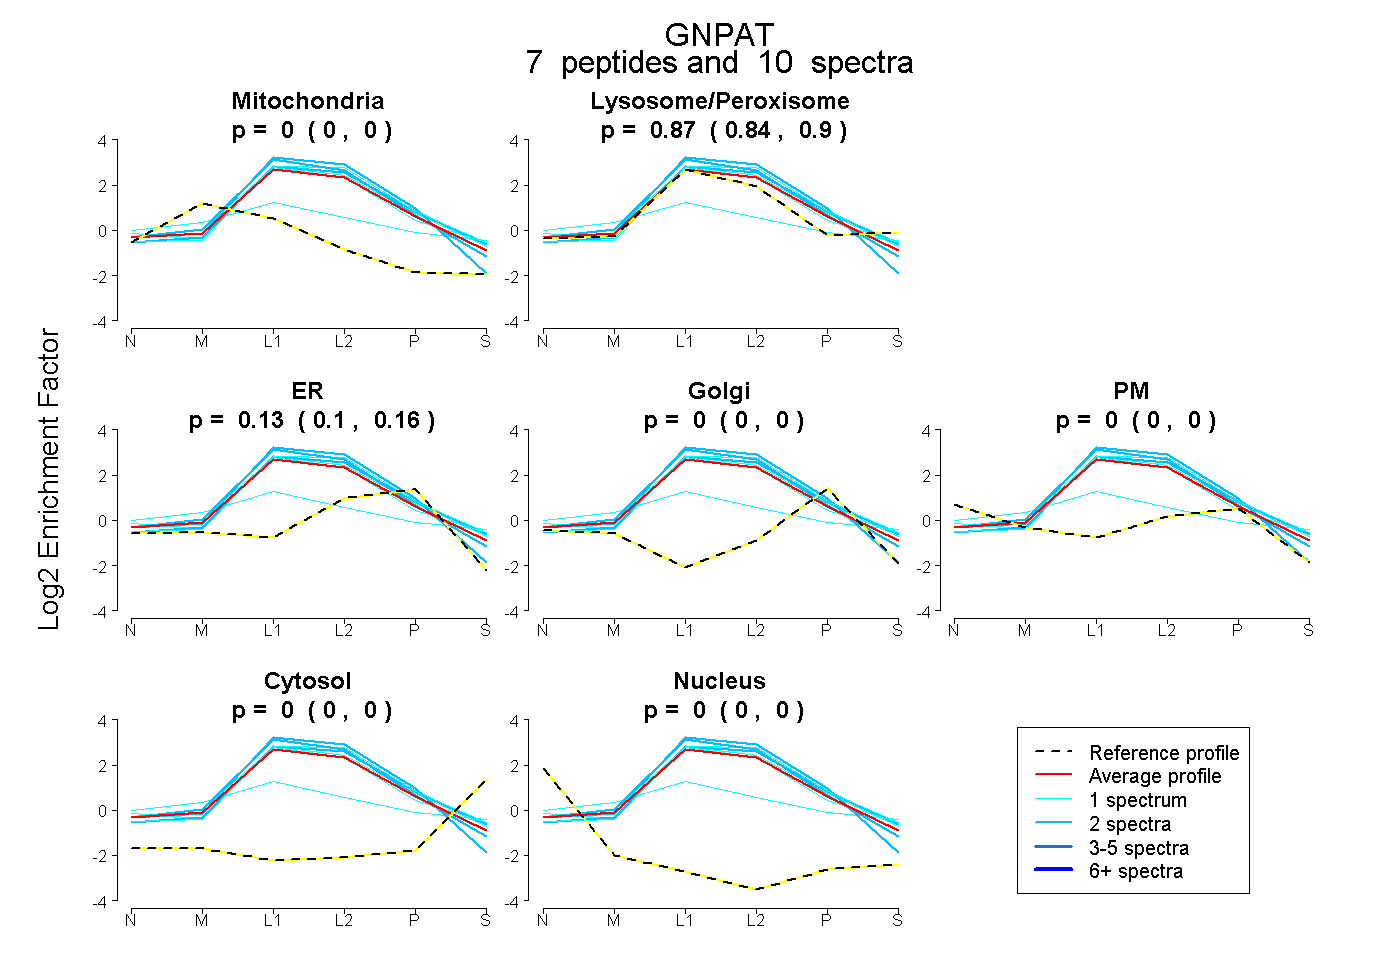
0.000 | 0.000
0.836 | 0.896
0.096 | 0.158
0.000 | 0.000
0.000 | 0.000
0.000 | 0.000
0.000 | 0.000