 15
15peptides
spectra
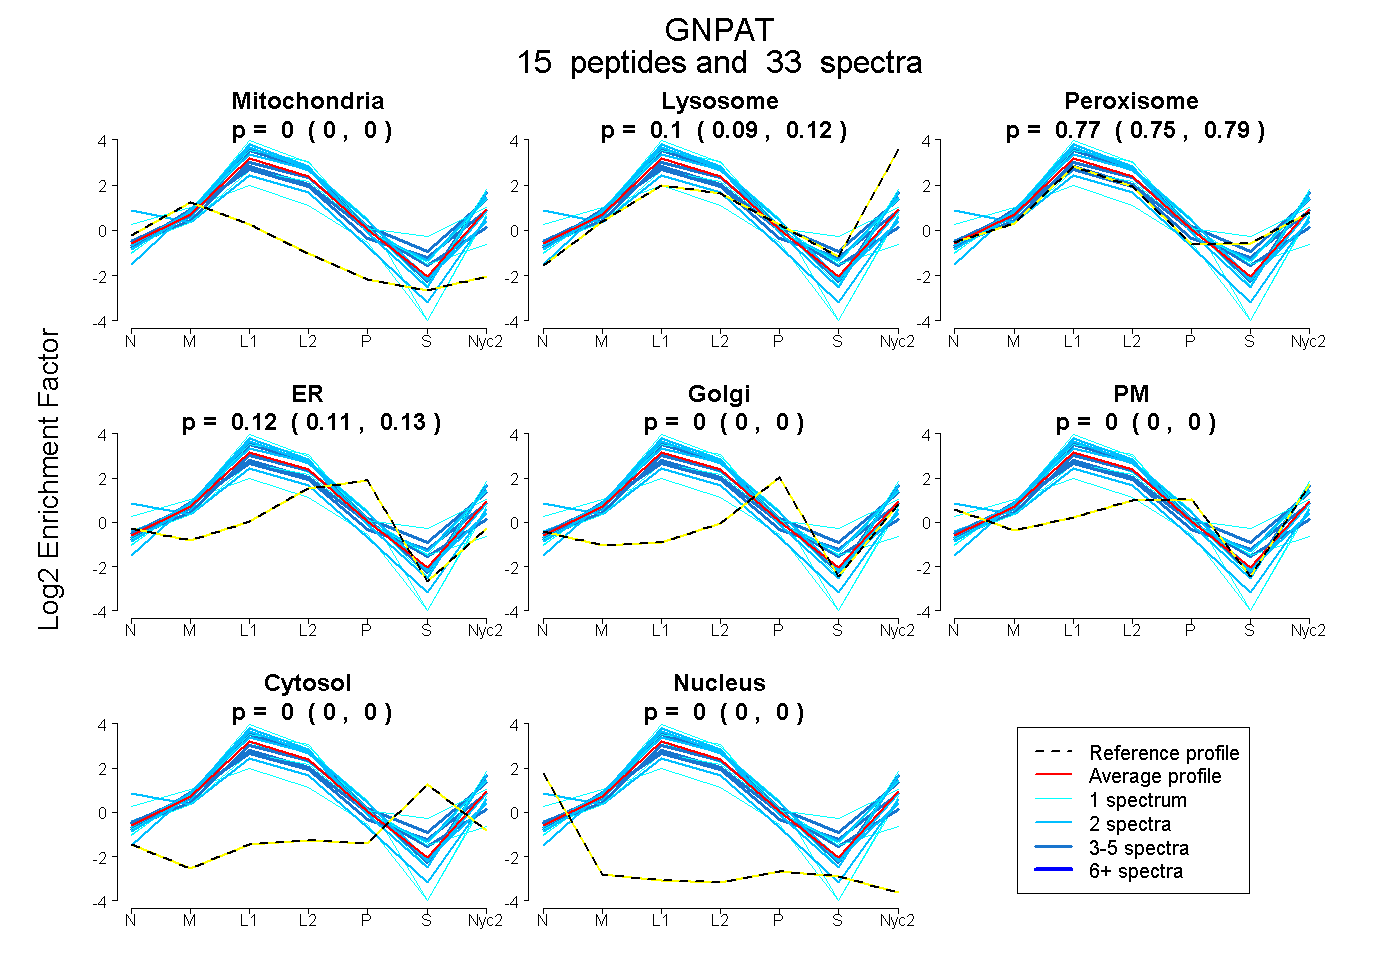
0.000 | 0.000
0.086 | 0.118
0.754 | 0.790
0.111 | 0.133
0.000 | 0.000
0.000 | 0.000
0.000 | 0.000
0.000 | 0.000
| Plot | Mito | Lyso | Perox | ER | Golgi | PM | Cytosol | Nucleus | |||||
| Expt A |
15 peptides |
33 spectra |
|
0.000 0.000 | 0.000 |
0.104 0.086 | 0.118 |
0.773 0.754 | 0.790 |
0.123 0.111 | 0.133 |
0.000 0.000 | 0.000 |
0.000 0.000 | 0.000 |
0.000 0.000 | 0.000 |
0.000 0.000 | 0.000 |
| 2 spectra, VCVNEEGIQK | 0.000 | 0.099 | 0.781 | 0.121 | 0.000 | 0.000 | 0.000 | 0.000 | ||
| 2 spectra, EYLVTAR | 0.182 | 0.000 | 0.463 | 0.000 | 0.000 | 0.355 | 0.000 | 0.000 | ||
| 3 spectra, CYTPPLYR | 0.046 | 0.000 | 0.799 | 0.155 | 0.000 | 0.000 | 0.000 | 0.000 | ||
| 1 spectrum, DFEEGCYLLCK | 0.042 | 0.000 | 0.787 | 0.170 | 0.000 | 0.000 | 0.000 | 0.000 | ||
| 1 spectrum, QPEDVQAFVTEVAYK | 0.000 | 0.362 | 0.638 | 0.000 | 0.000 | 0.000 | 0.000 | 0.000 | ||
| 1 spectrum, LEEMLGCK | 0.000 | 0.109 | 0.850 | 0.041 | 0.000 | 0.000 | 0.000 | 0.000 | ||
| 5 spectra, MSGAFFMR | 0.065 | 0.140 | 0.769 | 0.026 | 0.000 | 0.000 | 0.000 | 0.000 | ||
| 1 spectrum, AIQEHPVILLPSHR | 0.333 | 0.082 | 0.190 | 0.000 | 0.000 | 0.394 | 0.000 | 0.000 | ||
| 4 spectra, ESLTGVDVLR | 0.000 | 0.293 | 0.657 | 0.050 | 0.000 | 0.000 | 0.000 | 0.000 | ||
| 1 spectrum, CLLHEEDYFSEK | 0.000 | 0.133 | 0.593 | 0.275 | 0.000 | 0.000 | 0.000 | 0.000 | ||
| 2 spectra, NTYNLVPR | 0.000 | 0.287 | 0.713 | 0.000 | 0.000 | 0.000 | 0.000 | 0.000 | ||
| 1 spectrum, NVFSDEFIFLPGNTLR | 0.000 | 0.185 | 0.815 | 0.000 | 0.000 | 0.000 | 0.000 | 0.000 | ||
| 5 spectra, EEANEILEEMSHK | 0.000 | 0.208 | 0.757 | 0.034 | 0.000 | 0.000 | 0.000 | 0.000 | ||
| 2 spectra, EDVFSCFSFLR | 0.000 | 0.000 | 0.818 | 0.182 | 0.000 | 0.000 | 0.000 | 0.000 | ||
| 2 spectra, SGYAPVEFFLEGTR | 0.000 | 0.291 | 0.709 | 0.000 | 0.000 | 0.000 | 0.000 | 0.000 |
| Plot | Mito | Lyso or Perox | ER | Golgi | PM | Cytosol | Nucleus | ||||||
| Expt B |
7 peptides |
10 spectra |
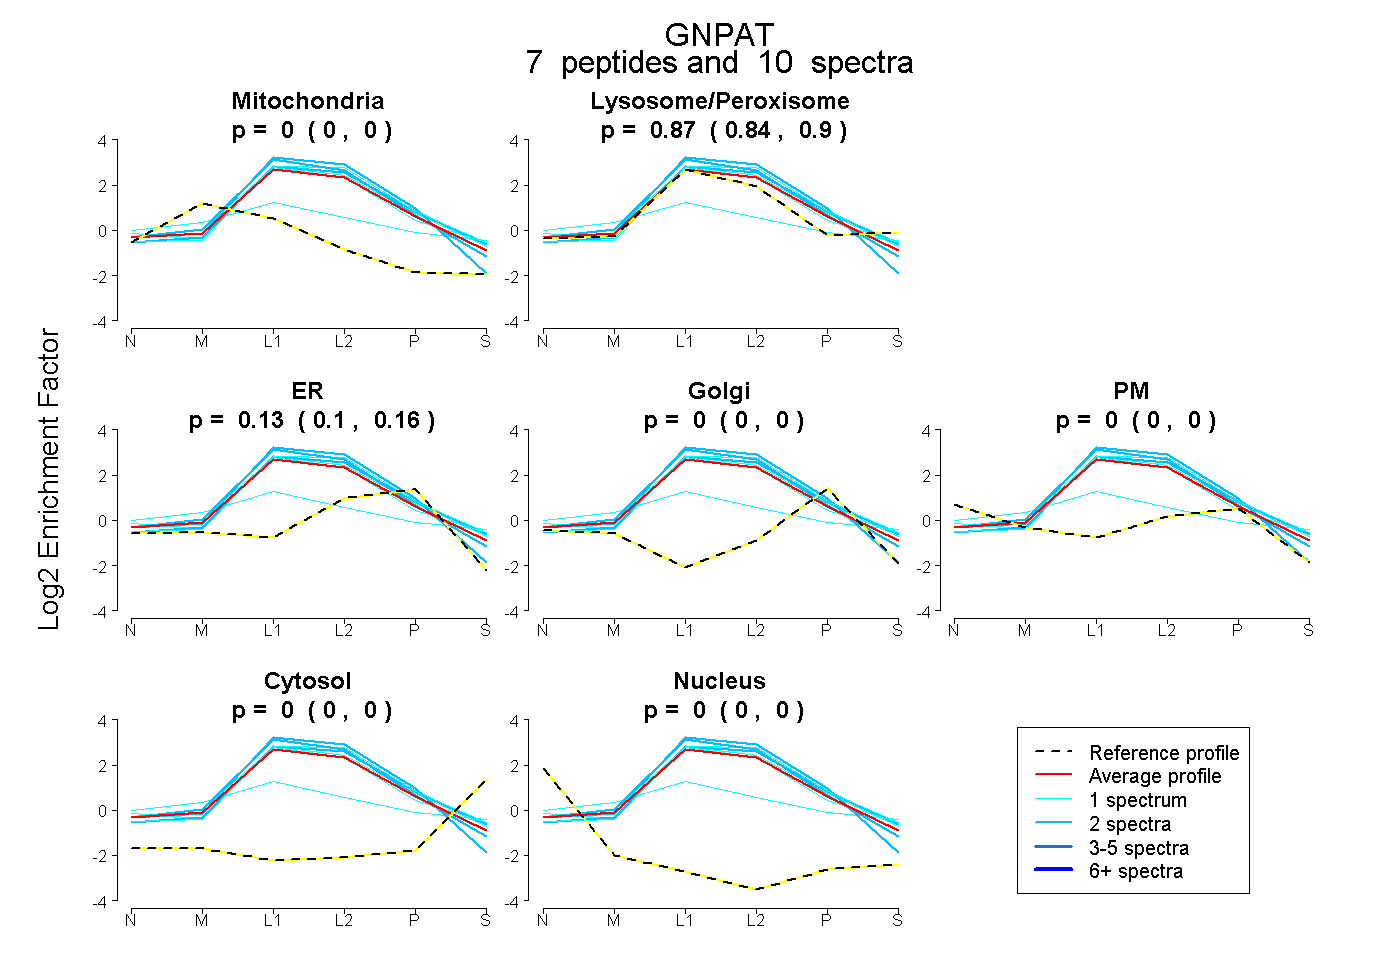 |
0.000 0.000 | 0.000 |
0.869 0.836 | 0.896 |
0.131 0.096 | 0.158 |
0.000 0.000 | 0.000 |
0.000 0.000 | 0.000 |
0.000 0.000 | 0.000 |
0.000 0.000 | 0.000 |
|||
| Plot | Lyso | Other | |||||||||||
| Expt C |
29 peptides |
148 spectra |
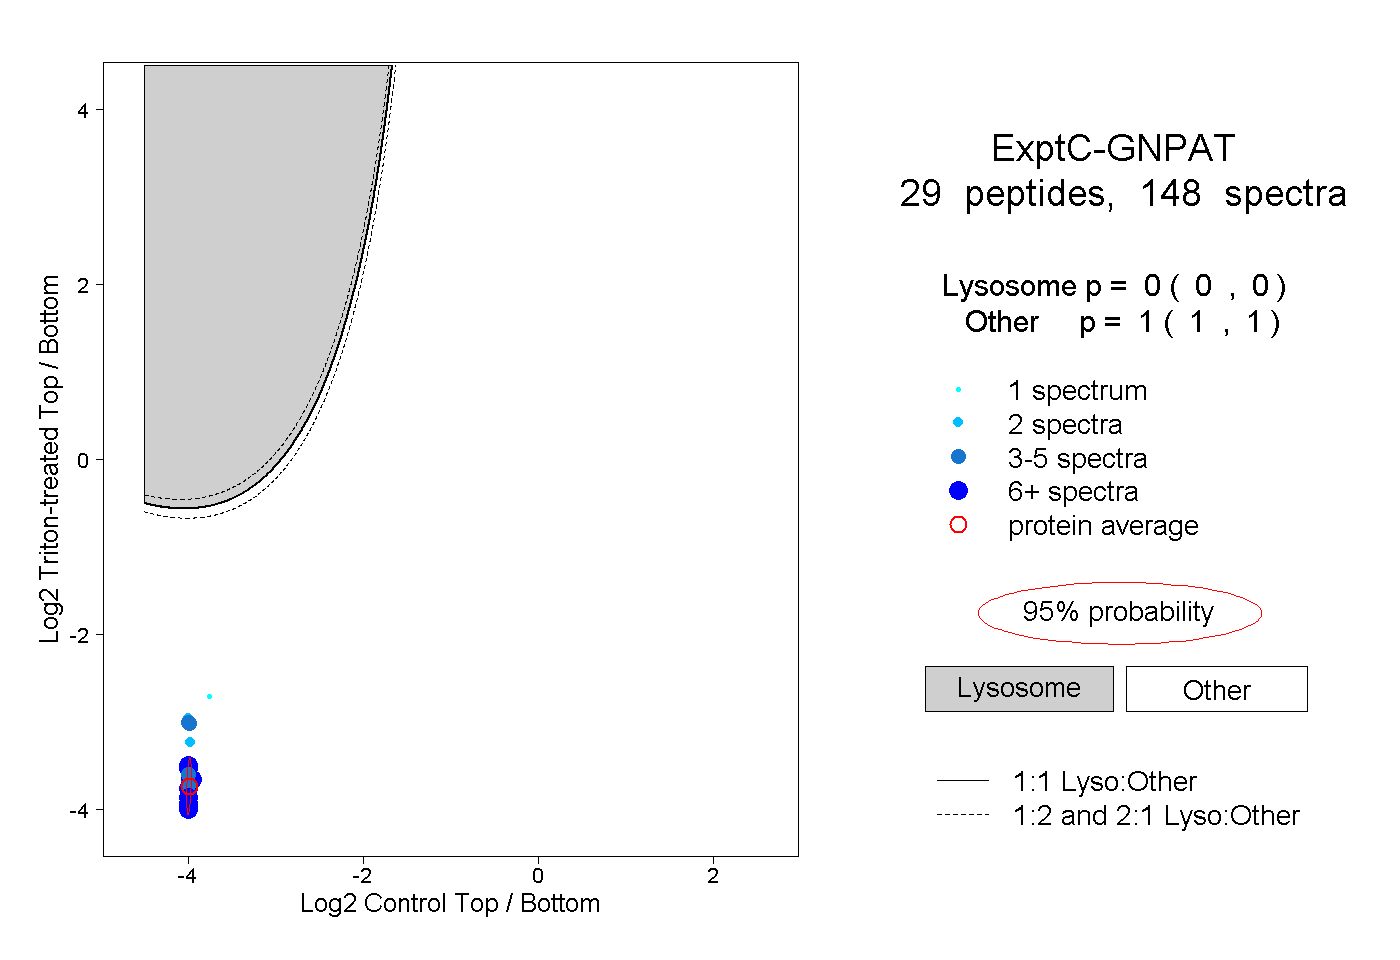 |
0.000 0.000 | 0.000 |
1.000 1.000 | 1.000 |
||||||||
| Plot | Lyso | Other | |||||||||||
| Expt D |
10 peptides |
16 spectra |
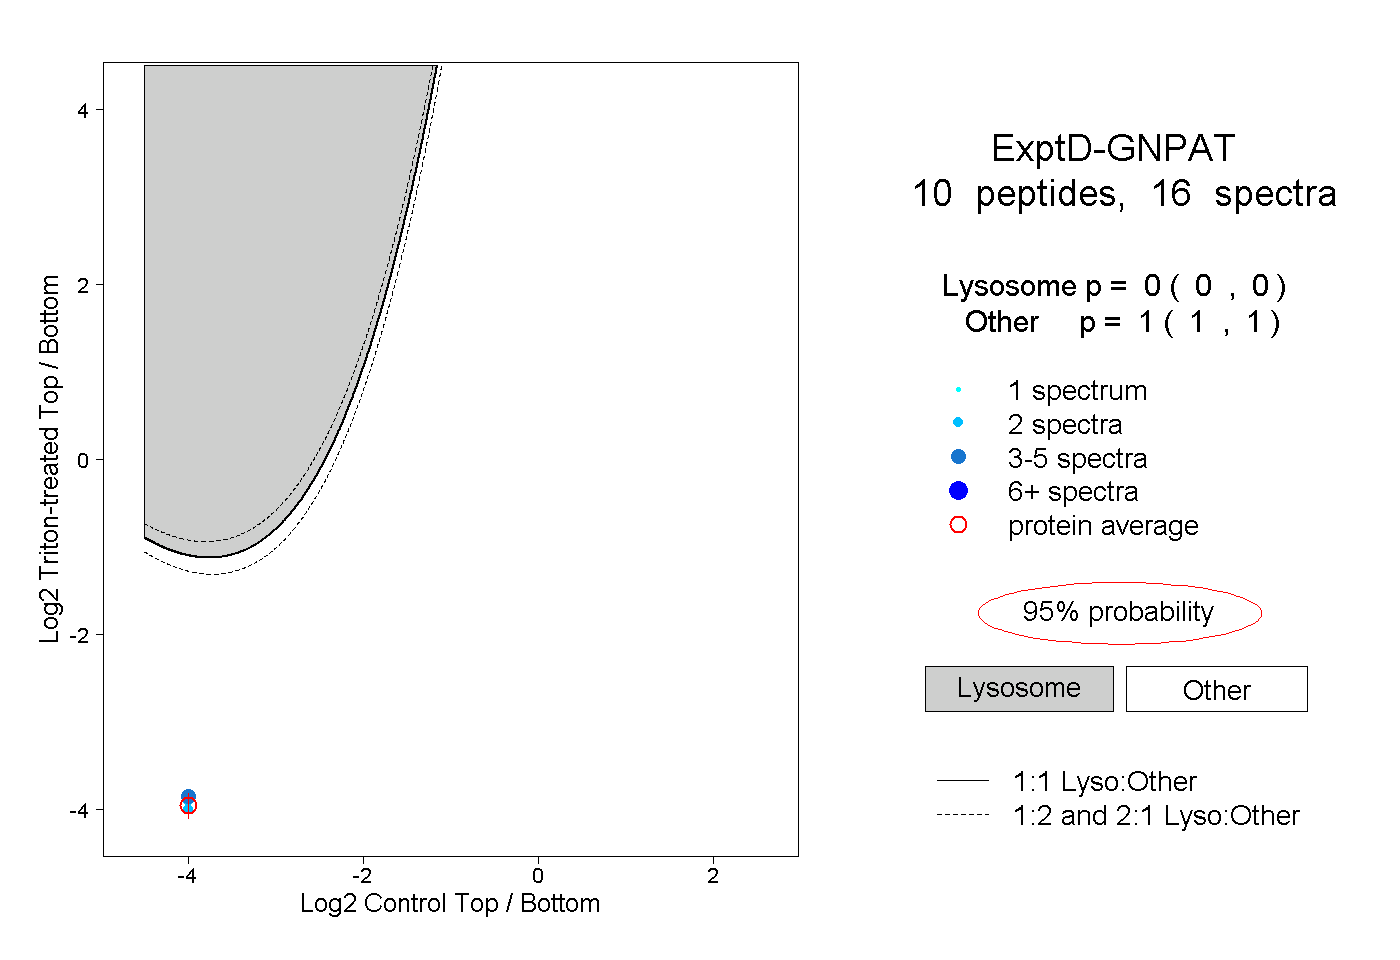 |
0.000 0.000 | 0.000 |
1.000 1.000 | 1.000 |