 7
7peptides
spectra
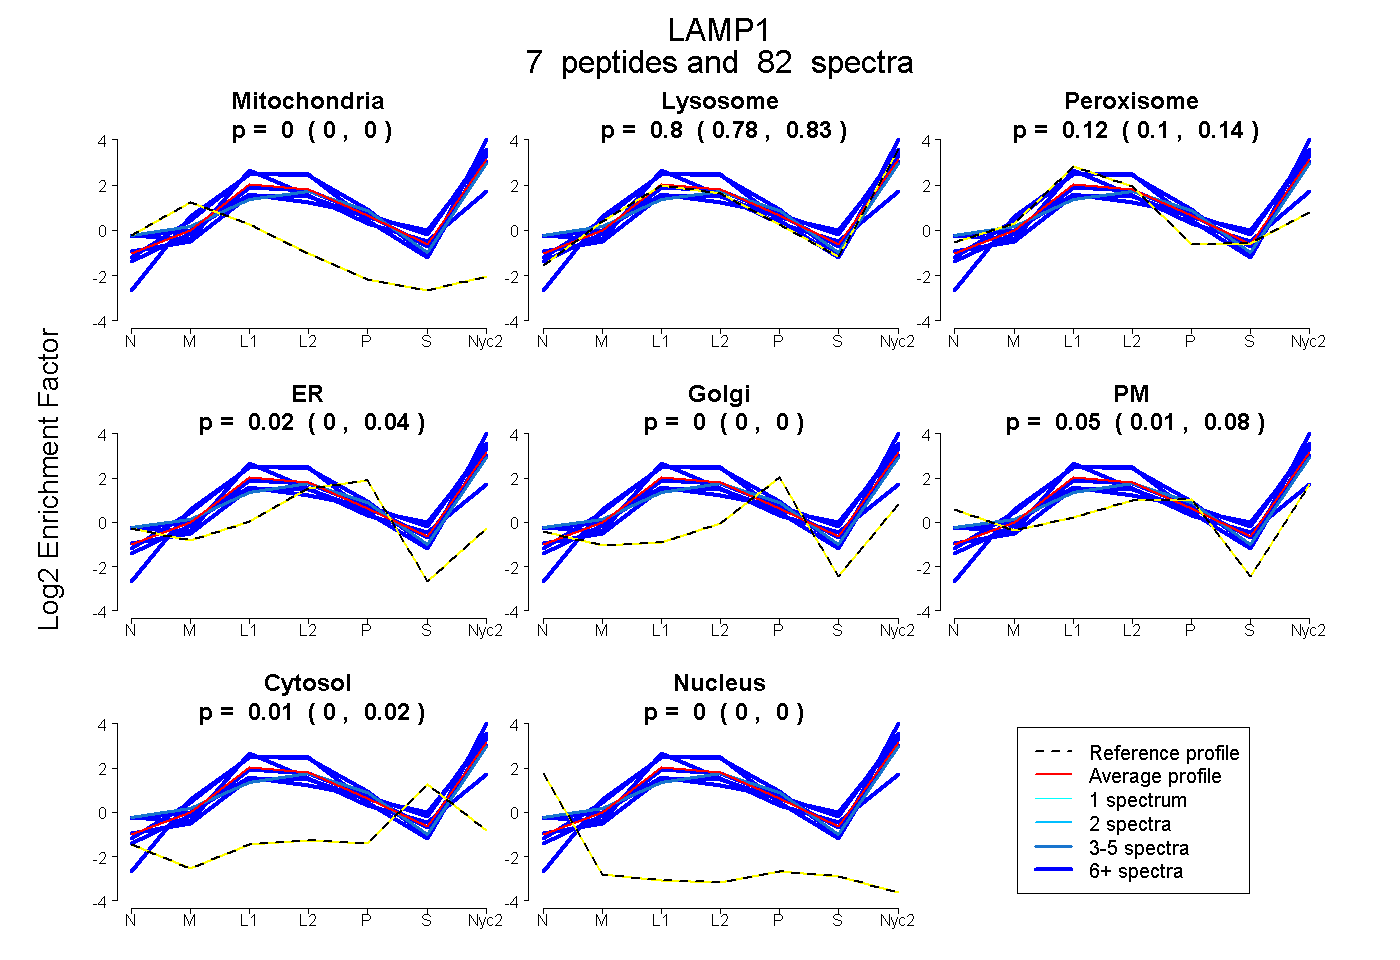
0.000 | 0.000
0.779 | 0.828
0.102 | 0.137
0.000 | 0.040
0.000 | 0.000
0.008 | 0.076
0.002 | 0.015
0.000 | 0.000
8peptides
spectra
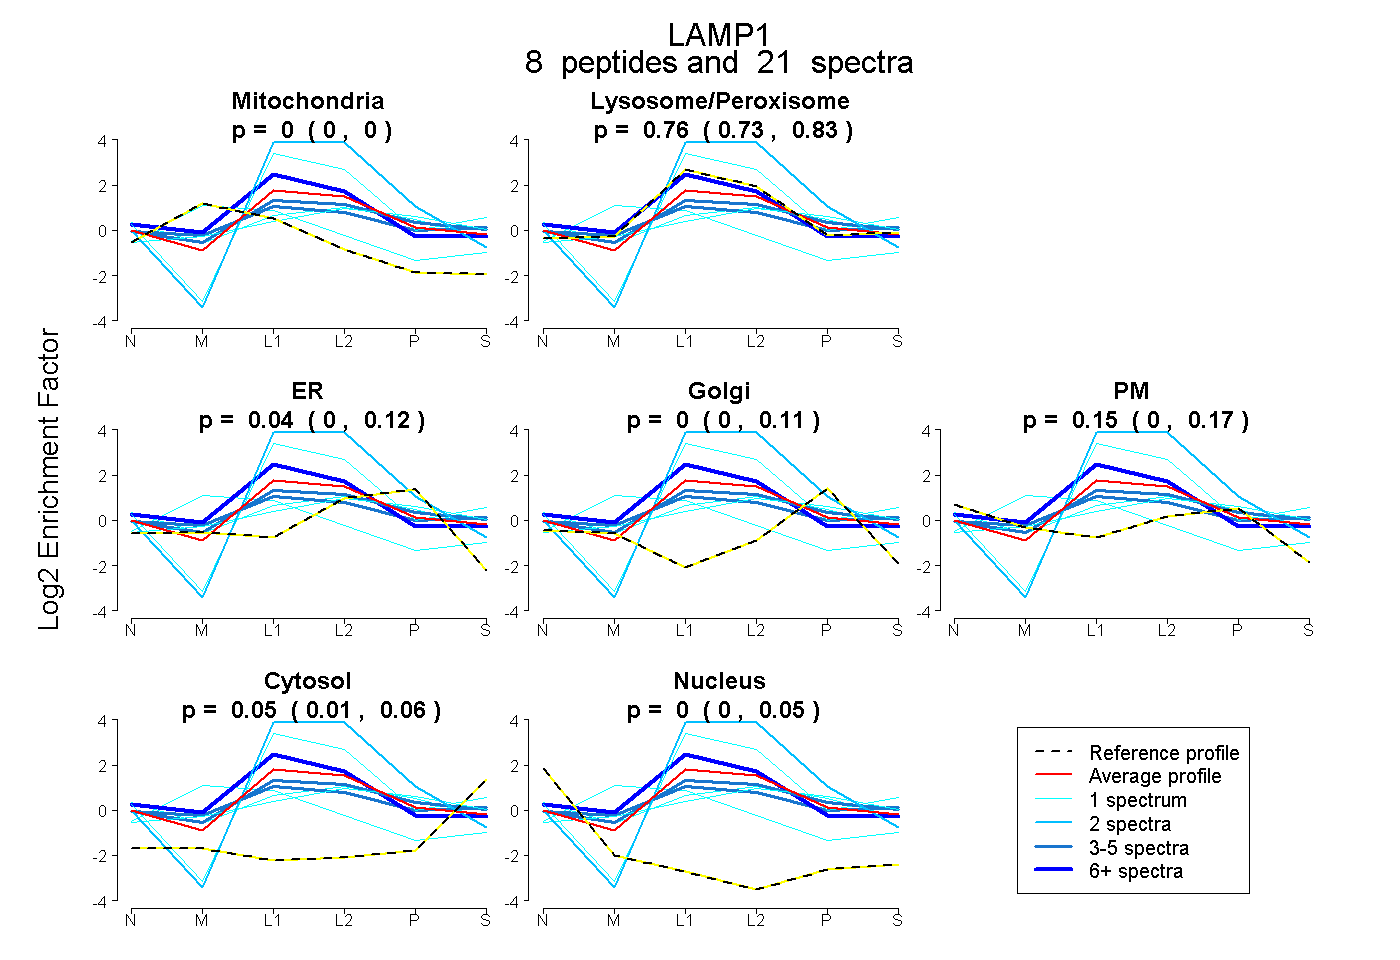
0.000 | 0.000
0.728 | 0.827
0.000 | 0.118
0.000 | 0.107
0.000 | 0.173
0.009 | 0.062
0.000 | 0.050
8peptides
spectra
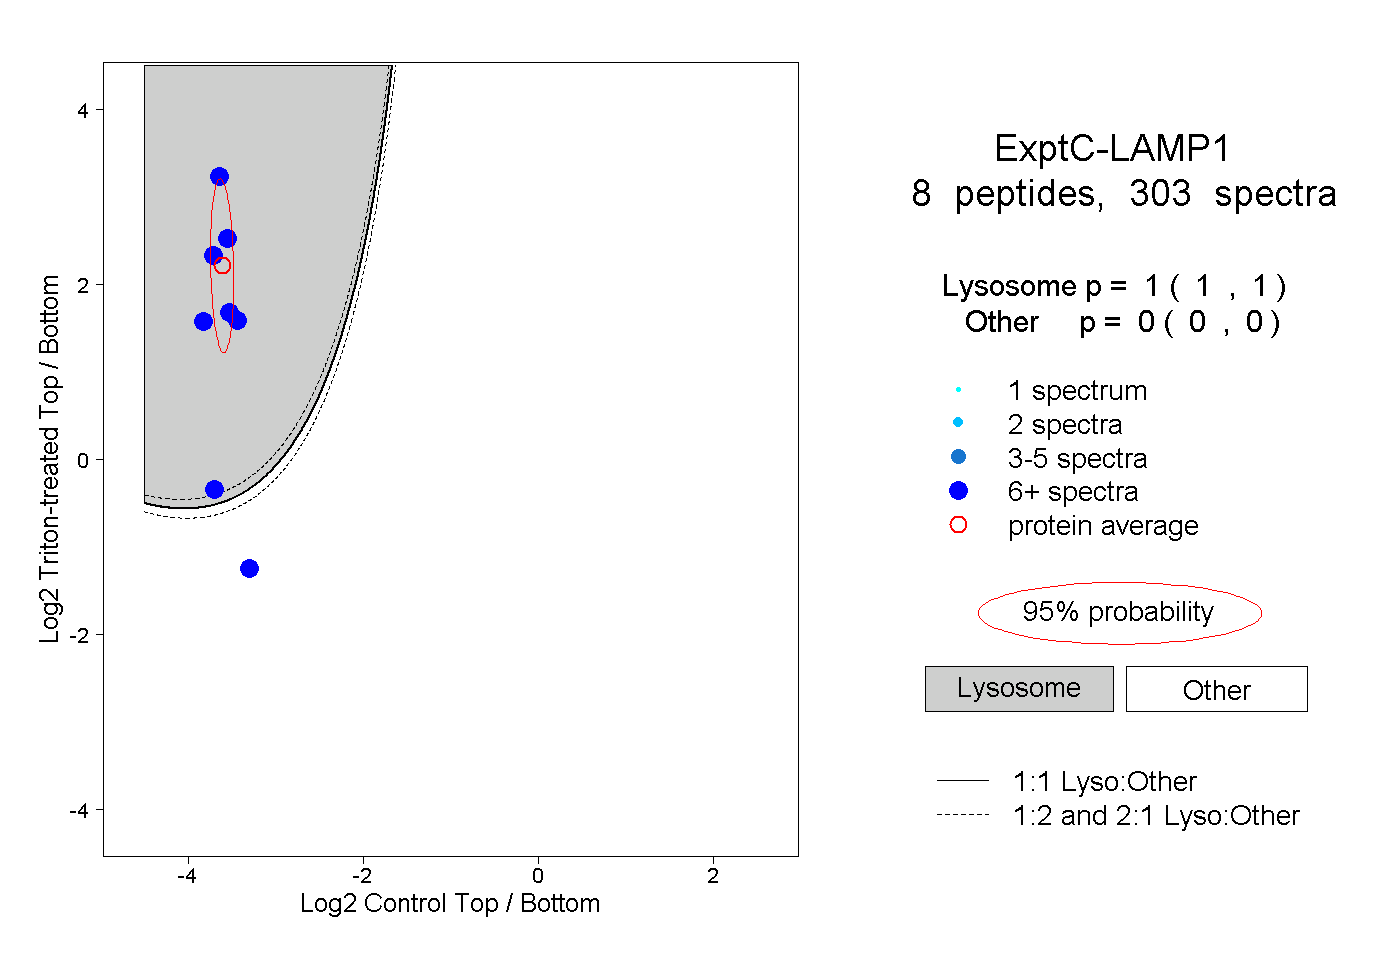
1.000 | 1.000
0.000 | 0.000
5peptides
spectra
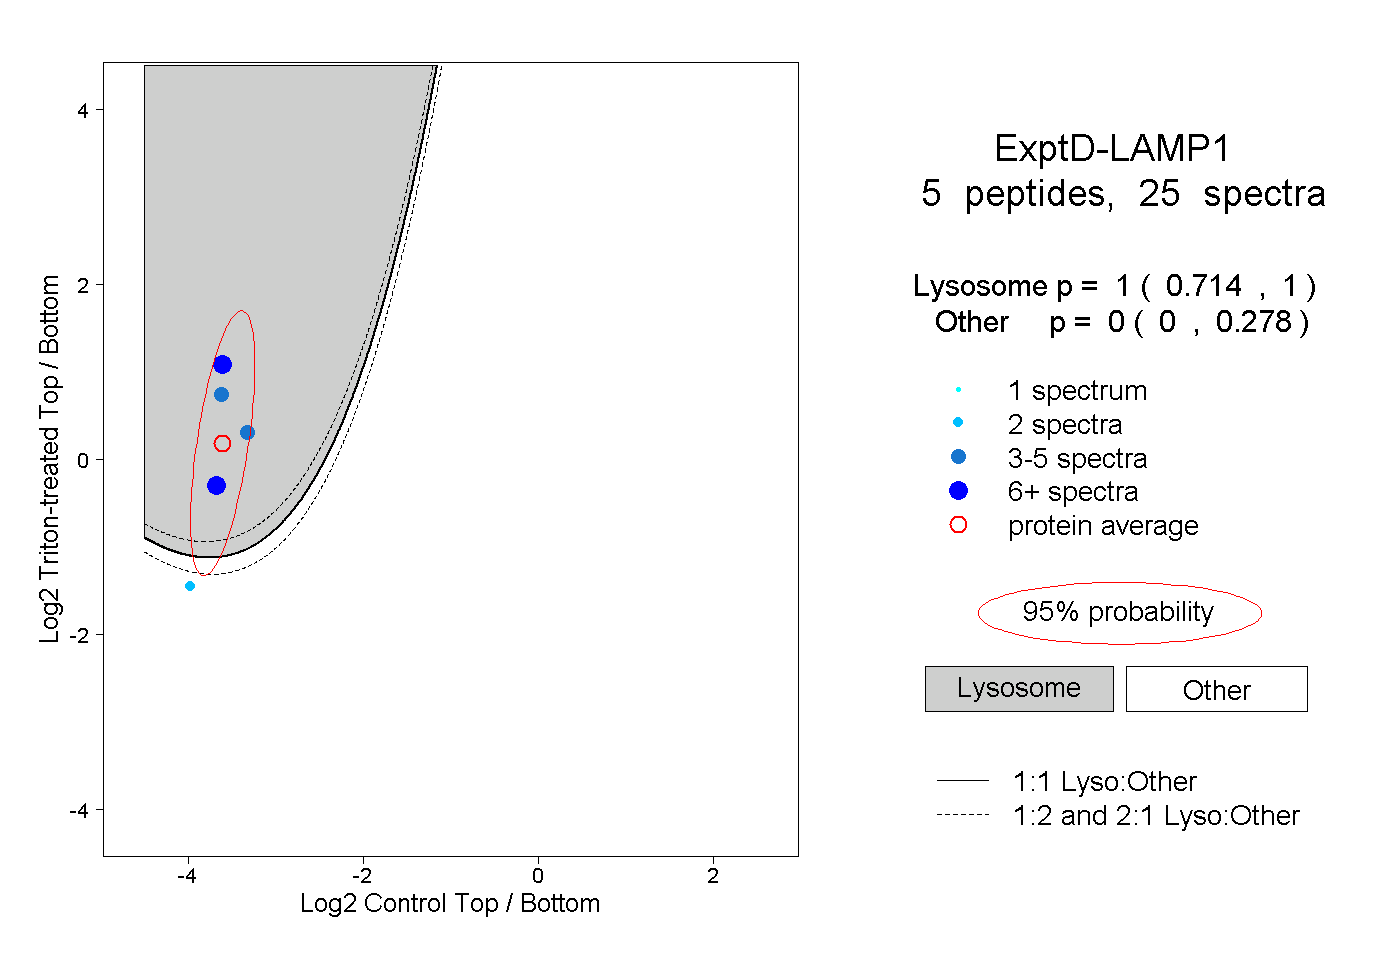
0.714 | 1.000
0.000 | 0.278